Polytrends
- Indicatori
- Versione: 1.0
- Attivazioni: 5

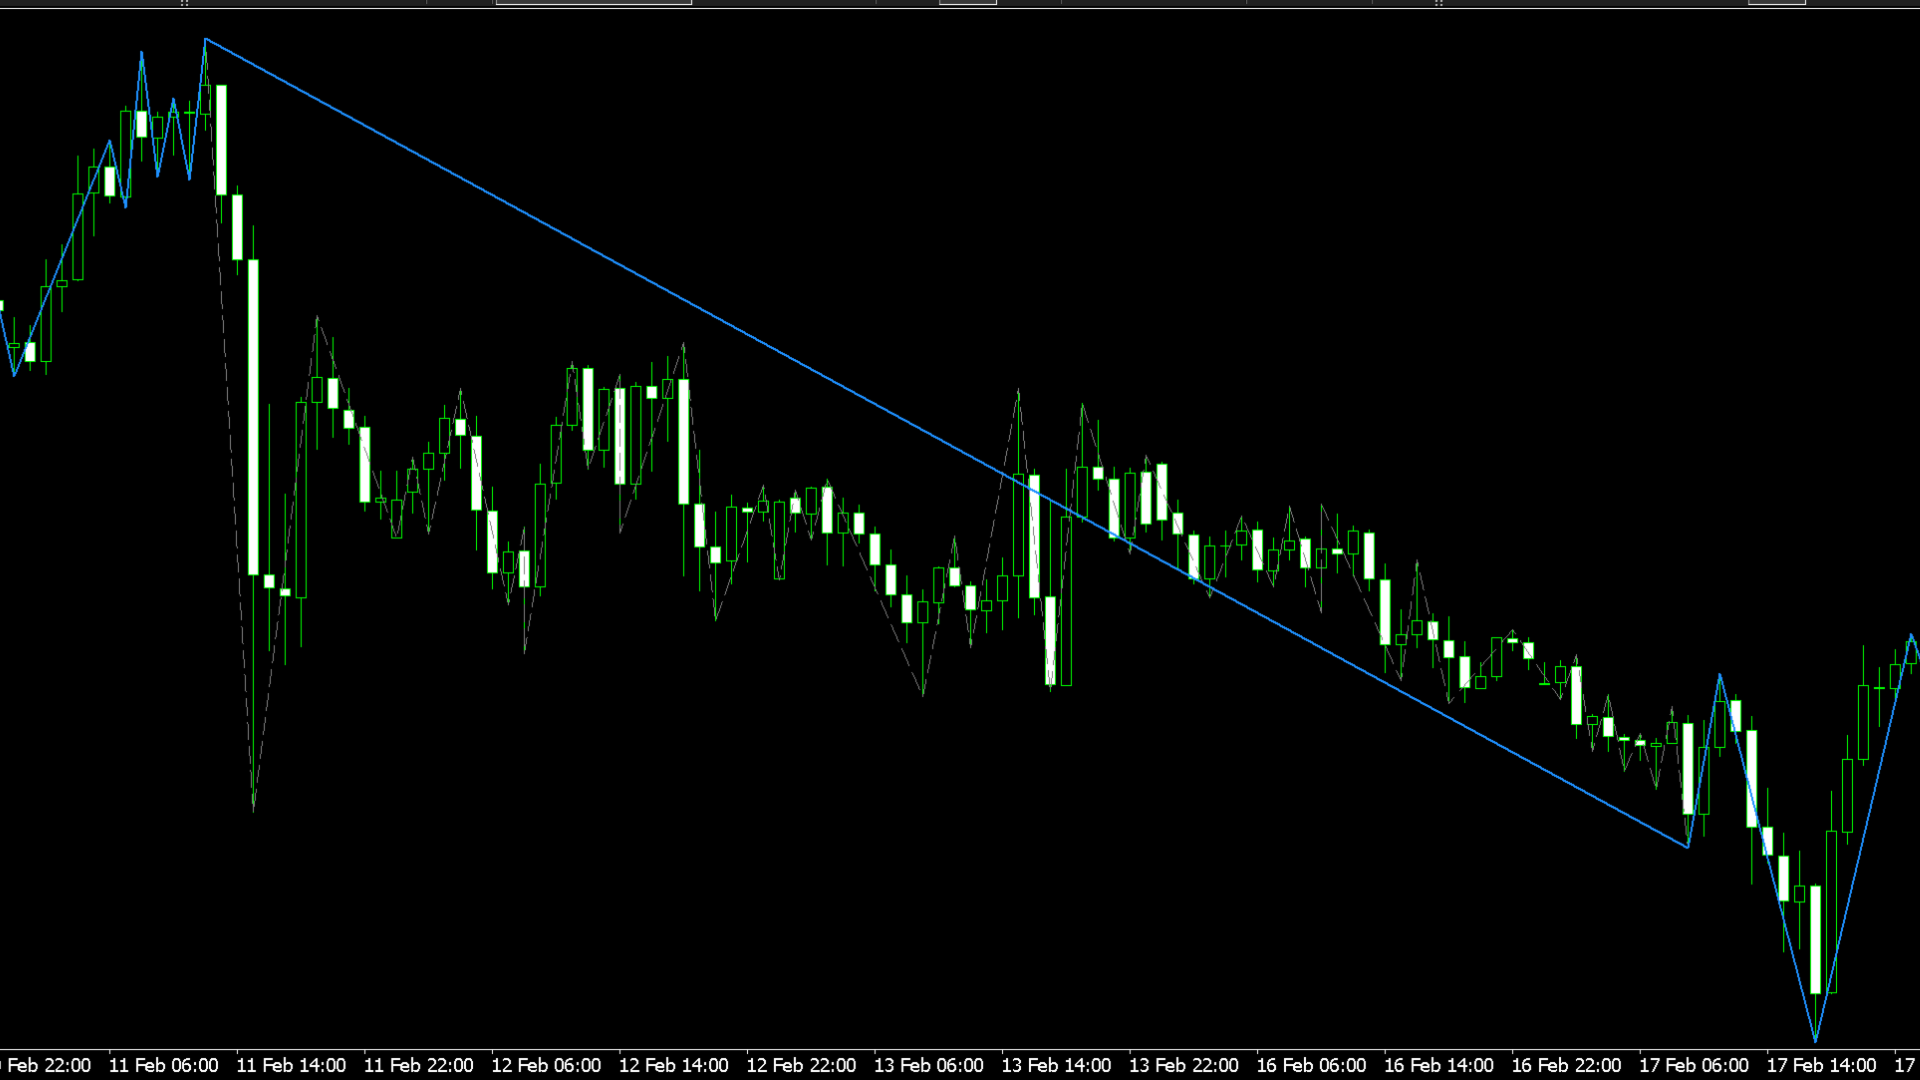
Polytrends is a trend direction and momentum indicator that draws a single clean solid line across price history, showing traders the dominant trend at a glance.
Reading the solid line — When the solid line is rising it signals an uptrend and traders look for buying opportunities. When it is falling it signals a downtrend and traders look for selling opportunities. The angle and length of the line gives a sense of trend strength and momentum.
Trend continuation — As long as price keeps making higher highs or lower lows in line with the solid line's direction, the trend is considered intact. Traders use this to stay in trades or add to positions.
Trend exhaustion and reversal — When the solid line changes direction it signals that the prior trend has ended and a new one may be beginning. This is the key signal for traders to consider closing existing positions or looking for entries in the opposite direction.
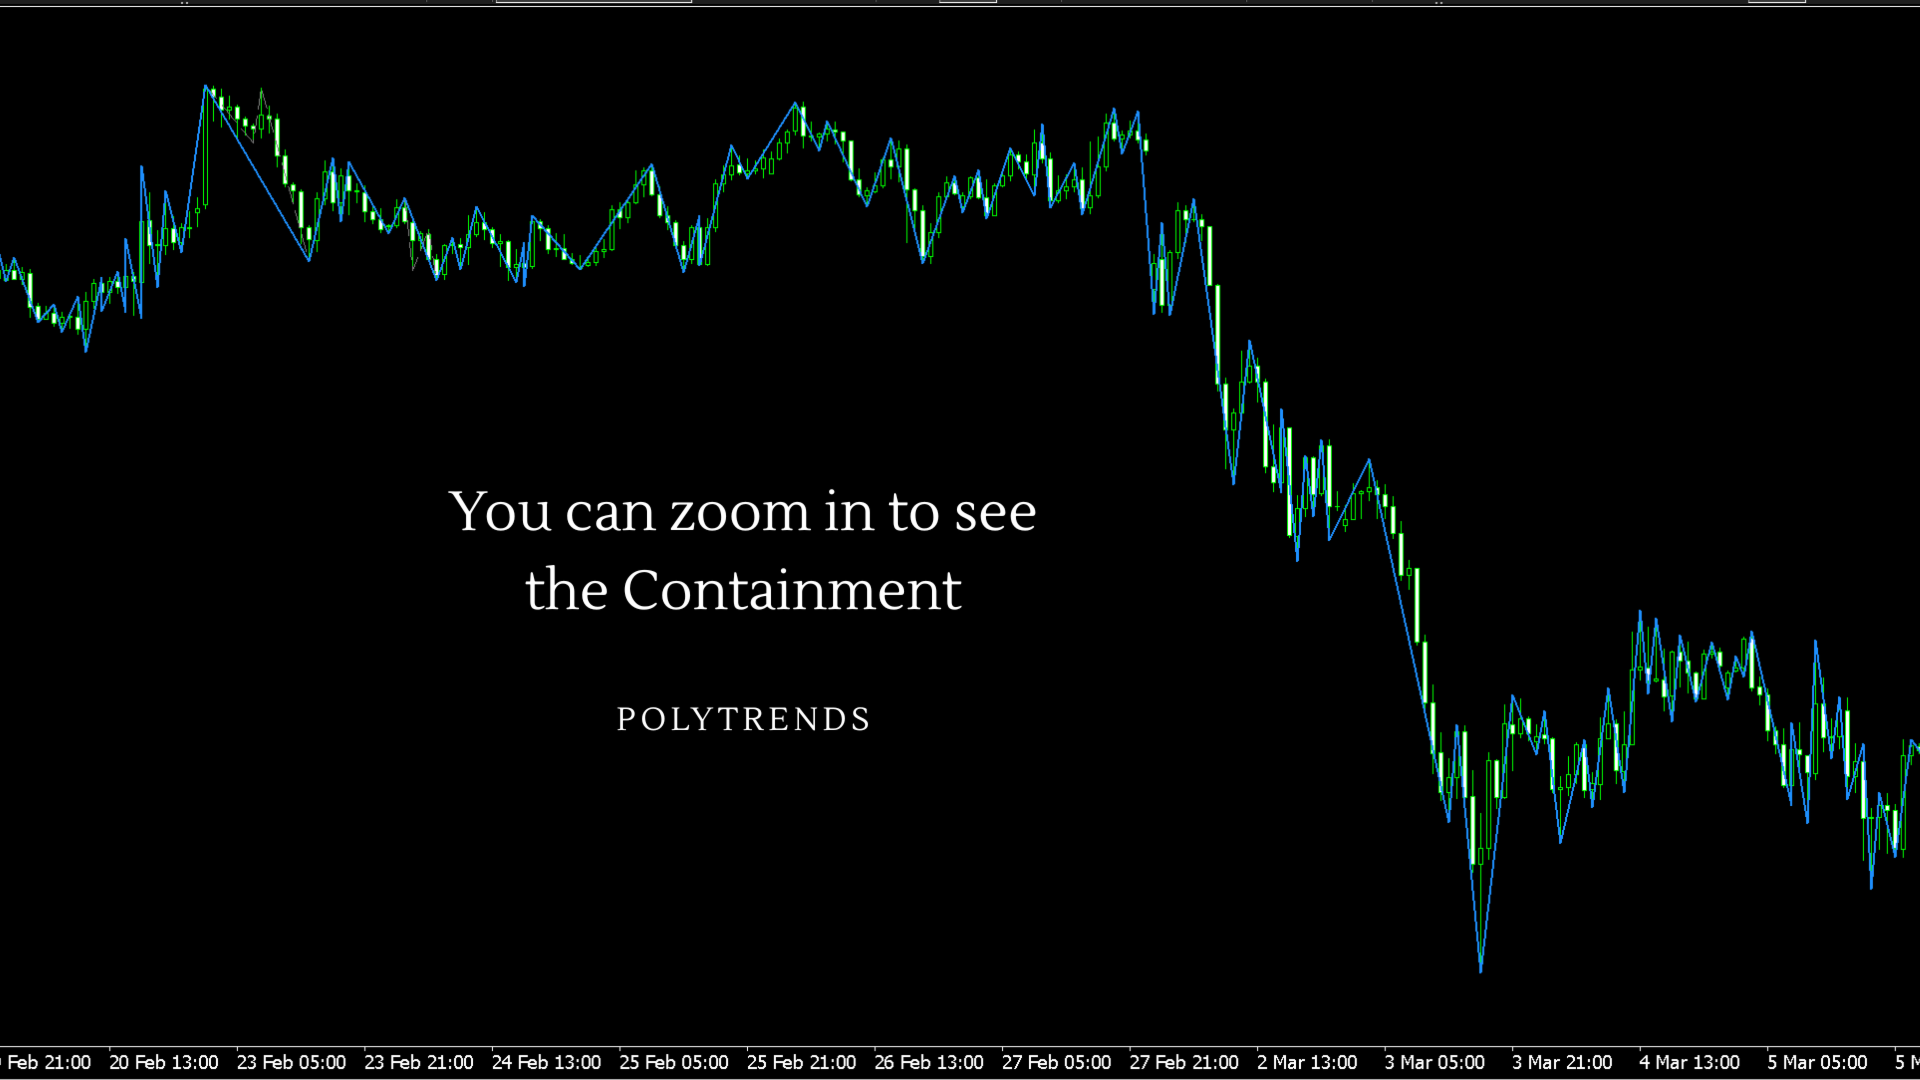
The dashed zigzag (Show Containment mode) — When enabled, the dashed lines show the internal waves that price made while the trend was developing. Traders use this to see how price consolidated or pulled back within the trend before continuing, which helps with identifying entry points during retracements.
Practical use — The indicator works on any market and any timeframe. Higher timeframes give fewer but more reliable signals. Traders typically use the solid line as a trend filter — only taking long trades when the line is rising and short trades when it is falling — and combine it with their own entry triggers for timing.