Institutional Cycle Filter ICF

Description

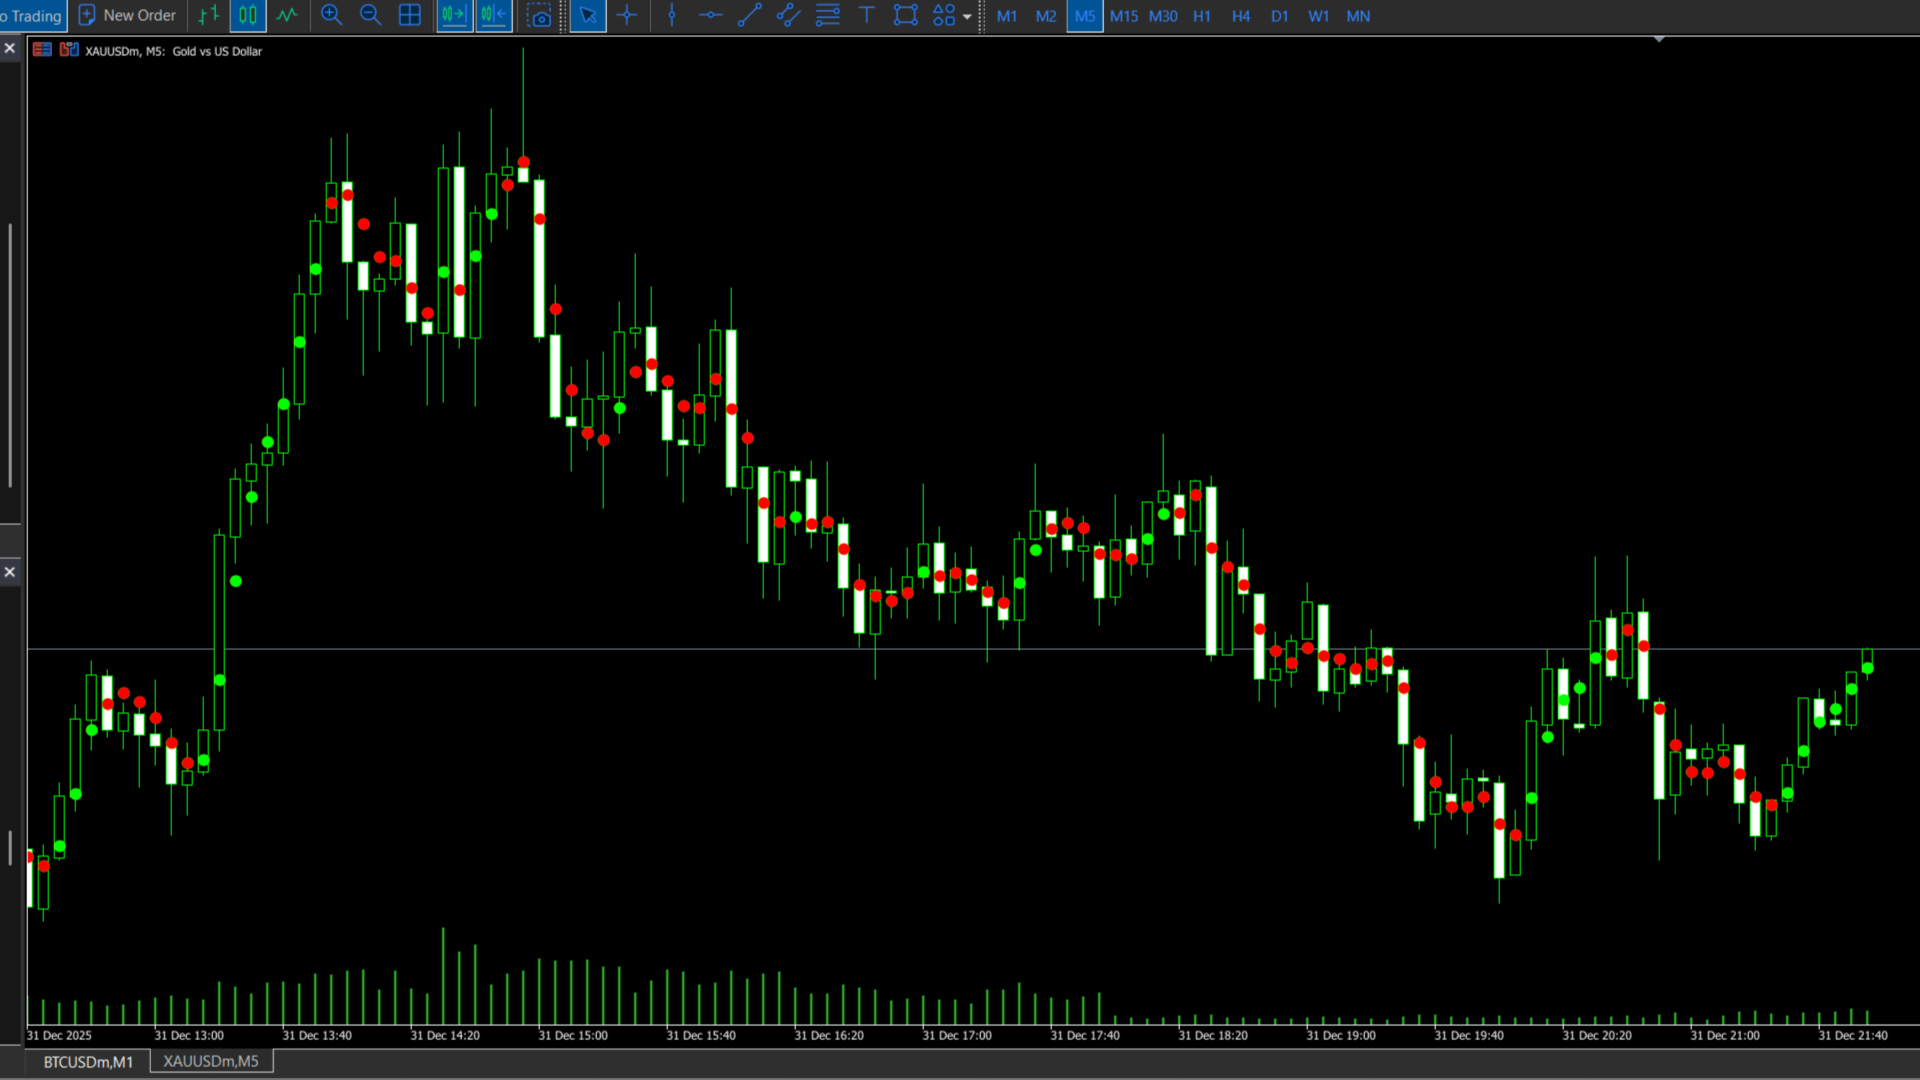
The Institutional Cycle Filter (ICF) is a sophisticated trend-following tool that replaces standard moving averages with a "Signal Dot" system. It is designed to minimize lag while maintaining smoothness, making it highly effective for identifying trend reversals in volatile markets like Gold.

How It Works (The Logic)

  1. Cosine Weighting: Unlike a Simple Moving Average (SMA) or Exponential Moving Average (EMA), this algorithm uses a Cosine function to calculate weights. This allows the indicator to "dampen" older data more effectively and react faster to recent price changes without the "whipsaw" effect of standard fast indicators.

  2. Point Filtering: It includes a Filter parameter (in points). If the calculated trend moves less than this amount, the indicator ignores the movement. This removes "flat" market noise.

  3. Color Logic:

    • Lime Dots: Up Trend (Price momentum is positive).

    • Red Dots: Down Trend (Price momentum is negative).

    • Yellow/Hidden: Neutral or flat market (if filtering is high).

Input Parameters Explained

  • Length (10): The main period of calculation. Higher values = smoother, slower line. Lower values = faster, more sensitive.

  • Filter (0): The noise filter.

    • Set to 0: Captures every small trend change (good for scalping).

    • Set to 50-100 (for Gold): Ignores small chops, only showing major trend shifts.

  • ColorBarBack (2): A visual setting that helps "paint back" the dots to make the visual trend line look continuous.

  • Deviation (0): Allows you to shift the line vertically by a percentage (useful for creating envelopes or bands, but usually kept at 0).

Why use this with your previous "Candle" indicator?

These two indicators work perfectly together as a Confluence System:

  1. The Candle Indicator (ATRStops): Shows you the Volatility Breakout.

  2. This Dot Indicator (ICF): Shows you the Momentum direction.

Signal Strategy:

  • Strong BUY: The Candles turn Green AND the Dots turn Green.

  • Strong SELL: The Candles turn Pink AND the Dots turn Red.


Prodotti consigliati
Trend Range Indicator
Claudius Marius Walter
5 (1)
Introduction Poppsir is a trend-range indicator for metatrader 5 (for now), which distinguishes sideways phases from trend phases. With this tool it is possible to design a trend following-, meanreversion-, as well as a breakout strategy. This indicator does not repaint! The signal of the Poppsir indicator is quite easy to determine. As soon as the RSI and Popsir change their respective color to gray, a breakout takes place or in other words, the sideways phase has ended. Interpretation
FREE
ADX Sniper
Van Minh Nguyen
ADX Sniper – Trend Strength Filter Tool ADX Sniper is a trend-strength signal indicator based on ADX and DI logic, combined with EMA trend confirmation to filter out weak and sideways market conditions. The indicator activates only when sufficient market momentum is detected, helping traders focus on structured trend opportunities. Trading signals are displayed directly on the chart with clear BUY and SELL arrows. The system is designed to reduce noise and avoid unnecessary entries during low-m
FREE
Trading Sessions by Mahefa R is an indicator for MetaTrader 5 that visually identifies the four main trading sessions: New York, London, Tokyo, and Sydney . Designed to provide a clean, intuitive, and professional market view, it highlights the most active periods of the Forex market using smart visualization of session ranges , session-specific candle colors , and daily separators . Main Features: Automatic detection of the 4 major sessions New York London Tokyo Sydney Each session is fully c
FREE
L'indicatore Flower è uno strumento di analisi tecnica utilizzato principalmente per identificare i trend e supportare le strategie di scalping o di trading intraday. L'indicatore Flower è un indicatore di trend basato sull'analisi tecnica e sulla dinamica dei prezzi. Segnala visivamente i trend utilizzando fiori colorati: i fiori blu indicano un trend rialzista, mentre i fiori rossi indicano un trend ribassista. Ogni livello può fungere da supporto e resistenza (osservare i livelli +/- 200 e
FREE
Breakout Shift Trader – MT5 Indicator Trade Like the Market Architects — Not the Victims. Most traders are fighting blind against a rigged game. Market makers engineer false breakouts, liquidity grabs, and “stop hunts” that wipe out retail accounts in seconds. Breakout Shift Trader flips the script. This MT5 indicator decodes the footprints left by institutional manipulation and aligns your trades with the power brokers driving real price action. Proven Results – Tested, Verified, Relentless N
FREE
VFI Quantum
Nikita Berdnikov
5 (1)
Introducing VFI (Volume Flow Indicator) – a trading indicator that analyzes the relationship between volume and price movement to identify key trading opportunities. The indicator displays the strength and direction of volume flow, providing clear signals about potential entry and exit points. Signals are formed based on zero line crossovers, crossovers between the VFI line and its exponential moving average (EMA), and when the indicator exits overbought and oversold zones. Attention! This stra
FREE
This indicator obeys the popular maxim that: "THE TREND IS YOUR FRIEND" Channel indicators incorporate volatility to capture price action. The Bollinger Bands is widely used, however, there are other options to capture swing action opportunities. Each study you will find here is unique, and reveals different types of price action. https://www.mql5.com/en/market/product/116256 https://www.mql5.com/en/market/product/115553
FREE
LT Force
Thiago Duarte
5 (5)
For those who like trend the Force will be a very useful indicator. This is because it is based on the famouse ADX, which measure the strenght of a trend, but without its 3 confusing lines. Force has its very simple interpretation: if the histogram is above zero level the trend is up, otherwise it is down. You can use it to find divergences too, which is very profitable. Thanks to Andre Sens for the version 1.1 idea. If you have any doubt or suggestion, please, contact me. Enjoy! MT4 version: 
FREE
SuperTrend TV
Tran Nhat Minh
5 (3)
Original supertrend indicator in Tradingview platform.  Indicator type: Price Action indicator Introduction:   The Supertrend Indicator - Enhancing Your Trend Analysis.  If you haven't yet found a Supertrend indicator with good graphics on the MQL5 platform, this is the indicator for you. Overview:   The Supertrend Indicator is a powerful tool designed to provide traders with valuable insights into the current and historical trends of financial markets. It serves as a valuable addition to any t
FREE
Ultimate MACD MTF Pro è una versione potente e aggiornata del classico MACD, riprogettata per il trading moderno. Questo indicatore offre MACD Multi-Timeframe (MTF), colori dinamici dell'istogramma, marcatori di segnale incrociato e cambi intelligenti di colore della linea basati sul momentum. Costruito per i trader che desiderano segnali puliti, rilevamento precoce del trend e chiarezza visiva di livello professionale. Caratteristiche Chiave MACD Multi-Timeframe (MTF) Passa facilmente dal
FREE
Show Pips for MT5
Roman Podpora
4.52 (27)
Questo indicatore informativo sarà utile per coloro che vogliono essere sempre informati sulla situazione attuale del conto. VERSION MT 4 -   More useful indicators L'indicatore mostra dati come profitto in punti, percentuale e valuta, nonché lo spread per la coppia corrente e il tempo fino alla chiusura della barra nell'intervallo di tempo corrente. Esistono diverse opzioni per posizionare la linea delle informazioni sulla carta: A destra del prezzo (corre dietro al prezzo); Come commento (nell
FREE
Renko Box
Andrey Dik
5 (1)
Description. The basis for the formation of the Renko chart is the price range. If the price goes beyond its limits, the chart shows a box above or below the previous one. As a result, we see price movement without additional "noise" and important support and resistance levels. Features. For use in conjunction with the Expert Advisor, an additional buffer is implemented-a box counter. For convenience and to increase the speed of testing, the user can use the "new box" event, which the indicator
FREE
The RSI with Moving Averages indicator combines the classic Relative Strength Index with customizable moving averages, offering deeper insights into market momentum and trend direction. By smoothing the RSI curve with short- and long-term averages, traders can better distinguish true reversals from noise. This tool highlights overbought and oversold levels, reveals divergences between price and momentum, and confirms entry or exit points with enhanced accuracy. Its adjustable parameters allow tr
FREE
Dynamic Supply and Demand indicator automatically identifies and displays Supply and Demand Zones on your chart based on price action patterns and market structure.  These zones represent areas where institutional buying or selling pressure has historically occurred, making them key levels for potential price reactions. This form of indicator takes inspiration from ICT as well as traditional Support & Resistance formation. **For the first 50 candles (number depends on LookBackCandles) when indic
FREE
Daily VWAP
Riccardo Moreo
4.8 (5)
This is the Volume Avarage Weighted Price (VWAP) it's a indicator that shows where is the avarage of the current volumes and the levels at which the price is considered premium, above the second upper band, or discount, under the second lower band, it's also very usefull to use the VWAP level as a target for operations since it's a very liquid level so the price it's attracted to it. feel free to leave a feedback either positive or negative based on your expereince with this indicator, enjoy the
FREE
This indicator is based on Bollinger Bands and moving averages, and uses ADX to get the turning point of the market trend and display a sign. It is basically intended for use with currency pairs and futures with high volatility. In our tests we use it on XAUUSD, 5m and 15m. Win rate is more than 80% with 50 pips stop loss and 50 pips gain or more. The indicator is also a simple indicator that allows you to enable or disable alerts and change the color of the arrows from the indicator settings
FREE
RSI Ultimate MTF
Quang Huy Quach
5 (1)
1. Introduction The CM_Ultimate_RSI_MTF is a powerful and versatile custom indicator for MetaTrader 5, designed to enhance your Relative Strength Index (RSI) analysis. It provides multi-timeframe (MTF) capabilities, visual signals, and customizable alerts, making it an invaluable tool for traders seeking to identify overbought/oversold conditions, trend strength, and potential entry/exit points across various timeframes. 2. Key Features Multi-Timeframe (MTF) Analysis: Allows you to view RSI from
FREE
Multi-timeframe trend indicator based on the ADX / ADXWilder indicator with Fibonacci levels The indicator shows trend areas using ADX or ADXWilder indicator data from multiple timeframes. The impulse mode of the indicator allows you to catch the beginning of a trend, and several "Screens" with different timeframes allow you to filter out market noise. Fibonacci levels are added to the price chart, which have flexible settings. How the indicator works: if PDI is greater than NDI, then   it`s
FREE
Indicator and Expert Adviser  EA Available in the comments section of this product. Download with Indicator must have indicator installed for EA to work. Mt5 indicator alerts for bollinger band and envelope extremes occurring at the same time. Buy signal alerts occur when A bullish candle has formed below both the lower bollinger band and the lower envelope  Bar must open and close below both these indicators. Sell signal occur when A bear bar is formed above the upper bollinger band and upper
FREE
Dsc Oscillator
Diogo Sawitzki Cansi
Recomended broker: https://tinyurl.com/5ftaha7c Indicator used to monitor price fluctuations in the market and discover possible reversals through reversal points or divergences in the indicator. All assets and all timeframes.   SEE OUR RESULTS ON INSTAGRAM:  https://www.instagram.com/diogo.cansi/   TELEGRAM GROUP =  https://t.me/robosdsc More information by email dscinvestimentos@gmail.com or by Whatsapp 55-991372299
FREE
Market Sessions Pre
Cao Minh Quang
4.8 (5)
The Market Sessions indicator is a popular tool among forex and stock traders for visually representing global trading sessions on a price chart. It highlights the time periods for major trading sessions — such as the Asian (Tokyo) , European (London) , and American (New York) sessions — directly on the chart. This helps traders identify when markets open and close, allowing for better decision-making based on session-specific trading behavior. - Asian Session (Default: 00:00-09:00) - London Se
FREE
Nova Oscillator Matrice Oscillatore Avanzata — Cinque Livelli Analitici in un Unico Indicatore La maggior parte degli oscillatori mostra solo una dimensione del mercato. Si può vedere il momentum o il volume, ma raramente entrambi insieme in modo significativo. Questo costringe i trader ad accumulare più indicatori, ognuno dei quali racconta una storia diversa, rendendo più difficile trovare setup ad alta convinzione. Nova Oscillator risolve questo problema combinando cinque potenti livelli anal
Basic Harmonic Pattern MT5
Mehran Sepah Mansoor
4.8 (89)
Questo indicatore identifica i   pattern armonici   più popolari che predicono i punti di inversione del mercato. Questi modelli armonici sono formazioni di prezzo che si ripetono costantemente nel mercato forex e suggeriscono possibili movimenti di prezzo futuri /   Versione MT4 gratuita Inoltre, questo indicatore è dotato di un segnale di entrata nel mercato e di vari take profit e stop loss. Va notato che, sebbene l'indicatore di pattern armonico possa fornire segnali di acquisto/vendita da
FREE
Phoenix Moving Average Meter
PHOENIX GLOBAL INVESTMENTS LTD
Phoenix Moving Average Meter (MT5) Strumento professionale di analisi e visualizzazione dei trend delle medie mobili per MetaTrader 5. Combina analisi intelligente della pendenza, misurazione della larghezza del cloud e classificazione del regime in un dashboard pulito e in tempo reale. Panoramica Phoenix Moving Average Meter analizza la relazione tra una media mobile veloce e una lenta per determinare la direzione, la forza e la maturità del trend. L'indicatore monitora continuamente l'angol
FREE
Supertrend etradro
Christian Opperskalski
5 (3)
The Supertrend etradro indicator is volatility based and is more of a trend following indicator in function. The ATR indicator, which is integrated into the calculation of the super trend, also calculates course gaps (gaps) and does not overlook them. This allows more accurate values to be calculated. When measuring volatility, the mean value of the current price serves as the basis. Since the Supertrend indicator features sliding stop and reversal lines, it is quite similar in function to the P
FREE
Follow The Line MT5
Oliver Gideon Amofa Appiah
4.6 (35)
This indicator obeys the popular maxim that: "THE TREND IS YOUR FRIEND" It paints a GREEN line for BUY and also paints a RED line for SELL. (you can change the colors). It gives alarms and alerts of all kinds. IT DOES NOT REPAINT and can be used for all currency pairs and timeframes. Yes, as easy and simple as that. Even a newbie can use it to make great and reliable trades. NB: For best results, get my other premium indicators for more powerful and reliable signals. Get them here: https://www.m
FREE
Trend indicator based on the ADX / ADXWilder indicator The indicator shows trend areas using ADX or ADXWilder indicator data. How the indicator works: if PDI is greater than NDI, then it`s bullish movement; if PDI is less than NDI, then it`s bearish movement; if ADX is less than or equal to the filter value specified in the parameters, then there is no movement state. Input parameters of the indicator: Calculate Timeframe - timeframe for calculation; ADX Type - type of ADX calculation based
FREE
The WaveTrend (LazyBear) indicator is a momentum-based oscillator designed to identify reversal points , trend strength , and overbought/oversold conditions in the market. It is widely used in both Forex and Cryptocurrency trading due to its ability to detect turning points earlier than traditional oscillators like RSI or Stochastic. (I have Converted from the original TradingView Pine Script version)
FREE
Smart Trend Suite Pro – Advanced Trend Indicator with Dashboard & Alerts Overview: Smart Trend Suite Pro is a powerful trend-detection indicator that offers traders a complete set of tools for accurate trend analysis and actionable insights. Designed for versatility and precision, Smart Trend Suite Pro adapts seamlessly to multiple timeframes and market conditions, making it suitable for various trading styles, including scalping and swing trading. Key Features: Real-Time Trend Detection: Identi
FREE
SuperTrend Indicator – Description & Important Notice The SuperTrend is a composite technical indicator designed to help you identify the primary trend, measure its strength, and assess signal quality. However, an indicator is only a tool —it’s never 100% accurate and cannot replace sound risk management. 1. Core Formula & Components ATR (Average True Range): measures price volatility; customize sensitivity via Periods and Multiplier . Upper/Lower Bands: derived from ATR and your chosen source p
FREE
Gli utenti di questo prodotto hanno anche acquistato
ARICoins
Temirlan Kdyrkhan
ARICoin is a powerful trading companion designed to generate high-probability entry signals with dynamic TP/SL/DP levels based on volatility. Built-in performance tracking shows win/loss stats, PP1/PP2 hits, and success rates all updated live. Key Features: Buy/Sell signals with adaptive volatility bands Real-time TP/SL/DP levels based on ATR Built-in MA Filter with optional ATR/StdDev volatility Performance stats panel (Success, Profit/Loss, PP1/PP2) Alerts via popup, sound, push, or email Cust
SuperScalp Pro
Van Minh Nguyen
5 (8)
SuperScalp Pro – Sistema avanzato di indicatore per scalping con filtri multipli SuperScalp Pro è un sistema avanzato di indicatore per scalping che combina il classico Supertrend con molteplici filtri di conferma intelligenti. L’indicatore funziona in modo efficiente su tutti i timeframe da M1 a H4 ed è particolarmente adatto per XAUUSD, BTCUSD e le principali coppie Forex. Può essere utilizzato come sistema stand-alone o integrato in modo flessibile nelle strategie di trading esistenti. L’indi
AriX
Temirlan Kdyrkhan
1 (4)
AriX Indicator for MT5 A powerful trend-following and signal-evaluation tool AriX is a custom MT5 indicator that combines Moving Averages and ATR-based risk/reward logic to generate clear buy/sell signals. It visualizes dynamic SL/TP levels, evaluates past trade outcomes, and displays win/loss statistics in a clean on-chart panel. Key features include: Buy/Sell signals based on MA crossovers ATR-based SL/TP1/TP2/TP3 levels with visual lines and labels Signal outcome tracking with real-time stat
Se acquisti questo indicatore, riceverai il mio Trade Manager Professionale + EA  GRATUITAMENTE. Innanzitutto è importante sottolineare che questo sistema di trading è un indicatore Non-Repainting, Non-Redrawing e Non-Lagging, il che lo rende ideale sia per il trading manuale che per quello automatico. Corso online, manuale e download di preset. Il "Sistema di Trading Smart Trend MT5" è una soluzione completa pensata sia per i trader principianti che per quelli esperti. Combina oltre 10 indicat
FX Trend MT5 NG
Daniel Stein
5 (4)
FX Trend NG: La Nuova Generazione di Intelligenza di Trend Multi-Mercato Panoramica FX Trend NG è uno strumento professionale di analisi del trend multi-timeframe e monitoraggio dei mercati. Ti consente di comprendere la struttura completa del mercato in pochi secondi. Invece di passare tra numerosi grafici, puoi identificare immediatamente quali strumenti sono in trend, dove il momentum sta diminuendo e dove esiste un forte allineamento tra i timeframe. Offerta di Lancio – Ottieni FX Trend NG
Entry In The Zone and SMC Multi Timeframe is a real-time market analysis tool developed based on Smart Money Concepts (SMC). It is designed to analyze market structure, price direction, reversal points, and key zones across multiple timeframes in a systematic way. The system displays Points of Interest (POI) and real-time No Repaint signals, with instant alerts when price reaches key zones or when signals occur within those zones. It functions as both an Indicator and a Signal System (2-in-1), c
Divergence Bomber
Ihor Otkydach
4.89 (83)
Ogni acquirente dell’indicatore riceverà inoltre gratuitamente: L’utilità esclusiva “Bomber Utility”, che gestisce automaticamente ogni operazione, imposta i livelli di Stop Loss e Take Profit e chiude le posizioni secondo le regole della strategia I file di configurazione (set file) per adattare l’indicatore a diversi asset I set file per configurare il Bomber Utility in tre modalità: “Rischio Minimo”, “Rischio Bilanciato” e “Strategia di Attesa” Una guida video passo-passo per installare, conf
Game Changer Indicator mt5
Vasiliy Strukov
4.8 (20)
Game Changer è un indicatore di tendenza rivoluzionario, progettato per essere utilizzato su qualsiasi strumento finanziario, per trasformare il tuo MetaTrader in un potente analizzatore di trend. Funziona su qualsiasi intervallo temporale e aiuta a identificare i trend, segnala potenziali inversioni, funge da meccanismo di trailing stop e fornisce avvisi in tempo reale per risposte tempestive del mercato. Che tu sia un professionista esperto o un principiante in cerca di un vantaggio, questo st
RFI levels PRO MT5
Roman Podpora
3.67 (3)
L'indicatore mostra accuratamente i punti di inversione e le zone di ritorno dei prezzi in cui il       Principali attori   . Vedi dove si formano le nuove tendenze e prendi decisioni con la massima precisione, mantenendo il controllo su ogni operazione. VERSION MT4     -    Rivela il suo massimo potenziale se combinato con l'indicatore   TREND LINES PRO Cosa mostra l'indicatore: Strutture di inversione e livelli di inversione con attivazione all'inizio di un nuovo trend. Visualizzazione dei li
Gold Entry Sniper
Tahir Mehmood
5 (5)
Gold Entry Sniper – Dashboard ATR Multi-Timeframe per Scalping e Swing Trading sull’Oro Gold Entry Sniper è un indicatore avanzato per MetaTrader 5 che offre segnali di acquisto/vendita precisi per XAUUSD e altri strumenti, basato sulla logica ATR Trailing Stop e l' analisi multi-timeframe . Caratteristiche e Vantaggi Analisi Multi-Timeframe – Visualizza trend su M1, M5, M15 in un'unica dashboard. Trailing Stop Basato su ATR – Stop dinamici che si adattano alla volatilità. Dashboard Professional
FX Power MT5 NG
Daniel Stein
5 (31)
FX Power: Analizza la Forza delle Valute per Decisioni di Trading Più Intelligenti Panoramica FX Power è lo strumento essenziale per comprendere la reale forza delle principali valute e dell'oro in qualsiasi condizione di mercato. Identificando le valute forti da comprare e quelle deboli da vendere, FX Power semplifica le decisioni di trading e rivela opportunità ad alta probabilità. Che tu segua le tendenze o anticipi inversioni utilizzando valori estremi di Delta, questo strumento si adatta
Power Candles MT5
Daniel Stein
5 (6)
Power Candles – Segnali di ingresso basati sulla forza per tutti i mercati Power Candles porta l’analisi di forza collaudata di Stein Investments direttamente sul grafico dei prezzi. Invece di reagire solo al prezzo, ogni candela viene colorata in base alla reale forza di mercato, consentendo di identificare immediatamente accumuli di momentum, accelerazioni della forza e transizioni di trend pulite. Un’unica logica per tutti i mercati Power Candles funziona automaticamente su tutti i simboli di
Trend Lines PRO MT5
Roman Podpora
5 (1)
LINEE DI TENDENZA PRO  Aiuta a capire dove il mercato sta realmente cambiando direzione. L'indicatore mostra reali inversioni di tendenza e punti in cui i principali operatori rientrano. Vedi   Linee BOS   Cambiamenti di tendenza e livelli chiave su timeframe più ampi, senza impostazioni complesse o rumore inutile. I segnali non vengono ridisegnati e rimangono sul grafico dopo la chiusura della barra. VERSIONE MT4   -   Svela il suo massimo potenziale se abbinato all'indicatore   RFI LEVELS PRO
Azimuth Pro
Ottaviano De Cicco
5 (4)
LAUNCH PROMO Azimuth Pro price is initially set at 299$ for the first 100 buyers. Final price will be 499$ . THE DIFFERENCE BETWEEN RETAIL AND INSTITUTIONAL ENTRIES ISN'T THE INDICATOR — IT'S THE LOCATION. Most traders enter at arbitrary price levels, chasing momentum or reacting to lagging signals. Institutions wait for price to reach structured levels where supply and demand actually shift. Azimuth Pro maps these levels automatically: swing-anchored VWAP, multi-timeframe structure lines, an
Smart Stop Indicator – Precisione intelligente dello stop-loss direttamente sul grafico Panoramica Smart Stop Indicator è la soluzione ideale per i trader che desiderano posizionare il loro stop-loss in modo chiaro e metodico, senza dover indovinare o affidarsi all’intuizione. Questo strumento combina la logica classica del price action (massimi e minimi strutturali) con un moderno riconoscimento dei breakout per identificare il prossimo livello di stop realmente logico. In trend, in range o i
Atomic Analyst MT5
Issam Kassas
4.1 (29)
Innanzitutto, vale la pena sottolineare che questo indicatore di trading non è repaint, non è ridisegno e non presenta ritardi, il che lo rende ideale sia per il trading manuale che per quello automatico. Manuale utente: impostazioni, input e strategia. L'Analista Atomico è un indicatore di azione del prezzo PA che utilizza la forza e il momentum del prezzo per trovare un miglior vantaggio sul mercato. Dotato di filtri avanzati che aiutano a rimuovere rumori e segnali falsi, e aumentare il pote
Trend Screener Pro MT5
STE S.S.COMPANY
4.84 (101)
Indicatore di tendenza, soluzione unica rivoluzionaria per il trading di tendenze e il filtraggio con tutte le importanti funzionalità di tendenza integrate in un unico strumento! È un indicatore multi-timeframe e multi-valuta al 100% non ridipingibile che può essere utilizzato su tutti i simboli/strumenti: forex, materie prime, criptovalute, indici e azioni. Trend Screener è un indicatore di tendenza che segue un indicatore efficiente che fornisce segnali di tendenza a freccia con punti nel gra
Quantum TrendPulse
Bogdan Ion Puscasu
5 (20)
Ecco   Quantum TrendPulse   , lo strumento di trading definitivo che combina la potenza di   SuperTrend   ,   RSI   e   Stocastico   in un unico indicatore completo per massimizzare il tuo potenziale di trading. Progettato per i trader che cercano precisione ed efficienza, questo indicatore ti aiuta a identificare con sicurezza le tendenze di mercato, i cambiamenti di momentum e i punti di entrata e uscita ottimali. Caratteristiche principali: Integrazione SuperTrend:   segui facilmente l'andame
FX Levels MT5
Daniel Stein
5 (13)
FX Levels: Supporti e Resistenze di Precisione Eccezionale per Tutti i Mercati Panoramica Rapida Cercate un modo affidabile per individuare livelli di supporto e resistenza in ogni mercato—coppie di valute, indici, azioni o materie prime? FX Levels fonde il metodo tradizionale “Lighthouse” con un approccio dinamico all’avanguardia, offrendo una precisione quasi universale. Basato sulla nostra esperienza reale con i broker e su aggiornamenti automatici giornalieri più quelli in tempo reale, FX
Grabber System MT5
Ihor Otkydach
4.82 (22)
Ti presento un eccellente indicatore tecnico: Grabber, che funziona come una strategia di trading "tutto incluso", pronta all’uso. In un solo codice sono integrati strumenti potenti per l’analisi tecnica del mercato, segnali di trading (frecce), funzioni di allerta e notifiche push. Ogni acquirente di questo indicatore riceve anche gratuitamente: L’utility Grabber: per la gestione automatica degli ordini aperti Video tutorial passo dopo passo: per imparare a installare, configurare e utilizzare
RelicusRoad Pro: Sistema Operativo Quantitativo di Mercato 70% DI SCONTO ACCESSO A VITA (TEMPO LIMITATO) - UNISCITI A 2.000+ TRADER Perché la maggior parte dei trader fallisce anche con indicatori "perfetti"? Perché operano su Singoli Concetti isolati. Un segnale senza contesto è una scommessa. Per vincere serve CONFLUENZA . RelicusRoad Pro non è un semplice indicatore. È un Ecosistema Quantitativo completo . Mappa la "Fair Value Road", distinguendo tra rumore e rotture strutturali. Smetti di in
Top indicator for MT5   providing accurate signals to enter a trade without repainting! It can be applied to any financial assets:   forex, cryptocurrencies, metals, stocks, indices .  Watch  the video  (6:22) with an example of processing only one signal that paid off the indicator! MT4 version is here It will provide pretty accurate trading signals and tell you when it's best to open a trade and close it. Most traders improve their trading results during the first trading week with the help of
IX Power MT5
Daniel Stein
4.92 (13)
IX Power: Scopri approfondimenti di mercato per indici, materie prime, criptovalute e forex Panoramica IX Power è uno strumento versatile progettato per analizzare la forza di indici, materie prime, criptovalute e simboli forex. Mentre FX Power offre la massima precisione per le coppie di valute utilizzando i dati di tutte le coppie disponibili, IX Power si concentra esclusivamente sui dati di mercato del simbolo sottostante. Questo rende IX Power una scelta eccellente per mercati non correlat
FX Dynamic MT5
Daniel Stein
5 (5)
FX Dynamic: Monitora volatilità e trend con un’analisi ATR personalizzabile Panoramica FX Dynamic è uno strumento potente che sfrutta i calcoli di Average True Range (ATR) per fornire ai trader informazioni impareggiabili sulla volatilità, sia giornaliera che intraday. Impostando soglie di volatilità chiare—ad esempio 80%, 100%, 130%—puoi individuare rapidamente opportunità di profitto o ricevere avvisi quando il mercato supera i range abituali. FX Dynamic si adatta al fuso orario del tuo brok
Mirage Trading System — False Breakout Reversal Indicator for MT5 False breakouts trap traders on the wrong side of the market dozens of times a day. Most traders see the breakout and enter. The Mirage Trading System is built to detect the moment that breakout fails — the snap-back that leaves breakout traders holding losing positions while the real move begins. The detection engine scans every completed bar for a complete 4-component Fakey pattern: a Range Candle establishing the price boundar
Trend Forecaster
Alexey Minkov
5 (7)
The Trend Forecaster indicator utilizes a unique proprietary algorithm to determine entry points for a breakout trading strategy. The indicator identifies price clusters, analyzes price movement near levels, and provides a signal when the price breaks through a level. The Trend Forecaster indicator is suitable for all financial assets, including currencies (Forex), metals, stocks, indices, and cryptocurrencies. You can also adjust the indicator to work on any time frames, although it is recommen
Trend indicator AI mt5
Ramil Minniakhmetov
5 (15)
Trend Ai indicator è un ottimo strumento che migliorerà l'analisi di mercato di un trader combinando l'identificazione della tendenza con punti di ingresso utilizzabili e avvisi di inversione. Questo indicatore consente agli utenti di navigare nelle complessità del mercato forex con fiducia e precisione Oltre ai segnali primari, l'indicatore Ai di tendenza identifica i punti di ingresso secondari che si presentano durante i pullback o i ritracciamenti, consentendo ai trader di capitalizzare le
ARIPoint
Temirlan Kdyrkhan
ARIPoint is a powerful trading companion designed to generate high-probability entry signals with dynamic TP/SL/DP levels based on volatility. Built-in performance tracking shows win/loss stats, PP1/PP2 hits, and success rates all updated live. Key Features: Buy/Sell signals with adaptive volatility bands Real-time TP/SL/DP levels based on ATR Built-in MA Filter with optional ATR/StdDev volatility Performance stats panel (Success, Profit/Loss, PP1/PP2) Alerts via popup, sound, push, or email Cu
Candle Smart Range
Gianny Alexander Lugo Sanchez
Candle Smart Range (CSR) per MetaTrader 5 Candle Smart Range è un indicatore tecnico progettato per l'identificazione automatica dei range di prezzo su più timeframe. Questo strumento analizza la struttura del mercato basandosi sulle formazioni delle candele e sull'interazione del prezzo con i massimi e i minimi precedenti. Caratteristiche principali: Rilevamento Range: Identifica le zone di consolidamento prima dei movimenti impulsivi. Identificazione Falsi Breakout: Segnala quando il prezzo su
Advanced Supply Demand MT5
Bernhard Schweigert
4.53 (15)
La migliore soluzione per qualsiasi principiante o trader esperto! Questo indicatore è uno strumento di trading unico, di alta qualità e conveniente perché abbiamo incorporato una serie di funzionalità proprietarie e una nuova formula. Con questo aggiornamento, sarai in grado di mostrare fusi orari doppi. Non solo potrai mostrare una TF più alta, ma anche entrambe, la TF del grafico, PIÙ la TF più alta: SHOWING NESTED ZONES. Tutti i trader di domanda di offerta lo adoreranno. :) Informazioni imp
Altri dall’autore
Phantom Flow
Mahmoud Ahmed Abdou Ali
5 (1)
This indicator is a hybrid SMC + Trend + Oscillator tool that draws market-structure objects on the chart and also plots trend shift lines + arrows and a colored oscillator histogram. It includes these modules: Phantom Shift (ATR trend shift / trailing bands) Swing Structure (BOS/CHoCH + swing points) Internal Structure (iBOS/iCHoCH) Order Blocks (swing + internal) Equal Highs / Equal Lows (EQH / EQL) Fair Value Gaps (FVG) Premium / Discount zones (range zones) Phantom Oscillator (MA
FREE
Supply and Demand X
Mahmoud Ahmed Abdou Ali
Supply and demand in trading describes how buyer (demand) and seller (supply) actions set asset prices, with high demand/low supply raising prices (premium) and low demand/high supply lowering them (discount); traders identify these imbalances as "zones" on charts (e.g., Rally-Base-Rally for demand, Drop-Base-Drop for supply) to find potential entry/exit points, aiming to buy at discount demand zones and sell at premium supply zones, using volume and price action to confirm institutional acti
FREE
Candle Color RSI
Mahmoud Ahmed Abdou Ali
Candle color RSI (Relative Strength Index) indicators change candlestick colors on the price chart to visually show RSI conditions like overbought/oversold levels or bullish/bearish momentum, using colors like red for overbought/bearish and green for oversold/bullish, helping traders spot reversals or strength at a glance without looking at the separate RSI pane. These custom indicators often color candles red above 70 (overbought), green below 30 (oversold), and keep default colors in between
FREE
Institutional QQE Oscillator (IQO) Description The Institutional QQE Oscillator (IQO) is a "momentum volatility" filter. Unlike a standard RSI which is jagged and noisy, the QQE uses a smoothing technique and a "Volatility Stop" mechanism (the yellow dotted line) on the RSI itself. Blue Line (Fast): The Smoothed RSI momentum. Yellow Dotted Line (Slow): The Volatility Threshold. Signal: When the Blue line crosses the Yellow line, it indicates a shift in true momentum, filtering out fake-outs. How
FREE
MA Ribbon
Mahmoud Ahmed Abdou Ali
The MA ribbon is not a single indicator but rather an overlay of multiple moving averages (typically four to eight or more) of varying lengths plotted on the same price chart.  Visual Appearance: The resulting lines create a flowing, ribbon-like pattern across the price chart. Components: Traders can use different types of moving averages, such as Simple Moving Averages (SMA) or Exponential Moving Averages (EMA), and adjust the time periods (e.g., 10, 20, 30, 40, 50, and 60 periods) to suit t
FREE
Here is the full professional description for your indicator, rebranded as Institutional Trend Candles (ITC) . You can use this text for your Market documentation, user manual, or simply to understand exactly how your tool functions. Institutional Trend Candles (ITC) v1.0 Overview Institutional Trend Candles (ITC) is a specialized trend-following system designed to filter out "retail noise" and visualize the true directional flow of the market. Built specifically for high-volatility assets like
FREE
Accurate Signal Pro
Mahmoud Ahmed Abdou Ali
3 (2)
Accurate Signal ARC is a non-repainting trend & reversal signal indicator designed for MT4 . It uses ATR-weighted volatility logic combined with adaptive price channels to detect high-probability BUY and SELL points directly on the chart. How It Works Calculates a dynamic volatility channel using weighted ATR Detects trend direction (river state) and switches only when price decisively breaks the channel Filters noise using spread-aware true range Draws clear arrows : Lime Arrow → BUY si
FREE
MM Ultimate Pro Analyzer v10.0 - USER GUIDEBASIC USAGEStep 1: Add to Chart Open any chart in MetaTrader 5 Go to Navigator → Indicators Find MM Ultimate Pro Analyzer Drag it onto your chart A settings window will appear Step 2: Configure for Your Timeframe Choose settings based on what you trade: Timeframe NumberOfCandles VolumeAveragePeriod M1-M5 (Scalping) 10-20 50 M15-M30 (Day Trading) 5-10 30 H1-H4 (Swing Trading) 3-7 20 D1+ (Position Trading) 3-5 14 Step 3: Understand the Button Bar At the t
Gann Square of Nine
Mahmoud Ahmed Abdou Ali
Here is the full technical and strategic description for the Gann Square of 9 indicator. Full Name Gann Square of 9 - Intraday Levels (v2.0) Overview This is a mathematical Support & Resistance indicator based on W.D. Gann's "Square of 9" theory. Unlike moving averages which lag behind price, this indicator is predictive . It calculates static price levels at the very beginning of the trading day (based on the Daily Open) and projects them forward. These levels act as a "road map" for the day,
FREE
Dema macd zone Divergence
Mahmoud Ahmed Abdou Ali
Indicator: The DEMA MACD Zone Divergence This is a powerful, multi-timeframe trend-following indicator based on the Moving Average Convergence Divergence (MACD) , but enhanced using Double Exponential Moving Averages (DEMA) for reduced lag. Its main function is to paint the background of the price chart with color-coded rectangular zones, clearly signaling the current momentum phase and potential shifts in market control (bullish or bearish). Core Purpose To visually map the strength and phas
FREE
The best eveR
Mahmoud Ahmed Abdou Ali
Indicator Name: "The Range Master" Core Purpose The Range Master is an advanced, multi-timeframe technical indicator designed to identify market consolidation (sideways ranging) and subsequent high-momentum breakout opportunities. It helps traders visually confirm when price action transitions from low-volatility accumulation to high-volatility trend initiation. ️ Functional Description (What it Does) The Range Master performs three primary, interconnected functions: Range Mapping , Breakout
FREE
Footprint MT5
Mahmoud Ahmed Abdou Ali
Footprint charts in MetaTrader 5 (MT5) provide traders with a detailed view of market activity, allowing for better analysis of price movements and trading decisions. What is a Footprint Chart? A footprint chart is a specialized visualization tool that displays market data beyond traditional candlestick or bar charts. It reveals how volume was distributed at each price level within a specific time frame, often segmented by bid and ask activity. This level of detail helps traders understand the
Trading Simulator X
Mahmoud Ahmed Abdou Ali
TradePanel Pro Indicator Testing & Trading Simulator Core Purpose (Clear & Honest) TradePanel Pro is a manual trading simulator designed to test indicators, signals, and strategies in real market conditions — without relying on automated logic. You see the signal → you click → you evaluate the result . What TradePanel Pro Is (Correct Positioning) Manual BUY / SELL execution panel Layered entries (multi-order testing) Real-time TP / SL behavior Trailing stop simulation Profit /
Edge loophole detector
Mahmoud Ahmed Abdou Ali
Quantitative Session Breakout Profiler & Data Miner Executive Summary: The "London Hunter v18.0" is not merely a buy/sell signal indicator; it is a statistical data mining engine . Its core idea is that market openings (London, NY, Asia) are not random, but distinct "micro-regimes." By measuring the specific "physics" of price movement (speed, pullback, candle size) during these opening windows, the system identifies which specific conditions lead to successful breakouts and which lead to fakeou
Institutional Physics Engine (IPE) v4.20 Market Structure, Liquidity & Valuation Diagnostic System WHAT THIS TOOL IS Institutional Physics Engine (IPE) is a real-time market diagnostics indicator that analyzes price using behavioral physics, liquidity response, supply & demand pressure, and equilibrium valuation. It does not predict price and does not generate blind buy/sell signals. Instead, it answers three professional trading questions: Where is fair value right now? Who is in con
Universal Strategy Validator: Turn Any Indicator into a Backtested Strategy Headline: Stop guessing if an indicator works. See the win rate, profit factor, and drawdown instantly—without writing a single line of code. Overview: The Universal Strategy Validator (USV) is a powerful analytical engine that connects to any MetaTrader 5 indicator. It reads the signal buffers (arrows, lines, or histograms) and runs a real-time simulation across historical data. It applies professional-grade filtering,
Candle Density Boxes
Mahmoud Ahmed Abdou Ali
Candle Density Boxes Indicator  Summary The Candle Density Boxes (CDB) indicator is an algorithmic tool that identifies price zones where candles cluster with high frequency. Through empirical analysis, we demonstrate that these zones exhibit statistically significant mean-reversion properties, with return frequencies ranging from 76–80% across multiple instruments. Key Findings: Zones with 6+ candle touches show 90%+ return probability Rank-based hierarchy provides clear reliability classifica
Summary (What Changed & Why It Matters) Traditional FVG indicators suffer from three structural flaws : Detection and mitigation are coupled Wicks and bodies are treated identically Partial mitigation is not preserved This indicator introduces a new FVG model where: Detection ≠ Mitigation Wick interaction ≠ Body acceptance FVGs decay progressively , not instantly This transforms FVGs from a static drawing tool into a dynamic price-acceptance model .
Matrix Oscillator
Mahmoud Ahmed Abdou Ali
MATRIX OSCILLATOR - Summary Guide WHAT IS IT? A multi-component oscillator that combines: Smart Money Flow (MFI-based histogram) Net Score (Trend strength from -100 to +100) Signal Line (Crossover reference) Confluence Zones (Confirmation areas) PhiSmoother Technology (Advanced noise filtering) STRONG BUY SIGNALS Component Condition Confluence Green zone filled (top) Money Flow Green bars above zero MFI Threshold MFI above green threshold line Net Score
3D Intensity Balls with Volume Boost Indicator v1.4 A sophisticated MetaTrader 5 custom indicator that visualizes price-level trading intensity using dynamically-sized, photorealistic 3D spheres rendered on the chart canvas, enhanced with volume-based scaling and advanced visual effects. Core Functionality Price Distribution Analysis: Divides each candle's price range into configurable levels (default: 50) Samples tick data to measure time-at-price (price dwell intensity) Visualizes concentra
All Symbols monitoring
Mahmoud Ahmed Abdou Ali
# All Trading Symbols Monitoring ## Version 9.43 | MT5 Indicator (Dual Mode) > An advanced multi-symbol trading monitor that watches all available broker symbols simultaneously, detects breakout opportunities, scores signal quality, and manages both paper and live trades - all displayed in a live on-chart dashboard. --- ## What This Tool Does - [ All Trading Symbols Monitoring ]( #all-trading-symbols-monitoring )   - [ Version 9.43 | MT5 Indicator (Dual Mode) ]( #version-943--mt5-indicator-
Lux Algo
Mahmoud Ahmed Abdou Ali
This system is a Self-Optimizing Algorithmic Framework . Unlike static indicators, it uses a Recursive Feedback Loop to "learn" the current market regime and adjust its sensitivity in real-time. Because it calculates every step based solely on current and past data, it is a Real-Time Model with no repainting, no bias, and no lookahead. How the "AI" Operates Performance-Based Learning: The system constantly "grades" its own accuracy. If the market is trending cleanly, it increases its sensitivit
Filtro:
Nessuna recensione
Rispondi alla recensione