Matrix Series Flower Indicator MT5
- Indicatori
-
Lorentzos Roussos
 🎱🏓🎷💚☕️
💎 The simplest Neural Network Coding Guide : https://www.mql5.com/en/blogs/post/752324 - Versione: 1.0
L'indicatore Flower è uno strumento di analisi tecnica utilizzato principalmente per identificare i trend e supportare le strategie di scalping o di trading intraday.
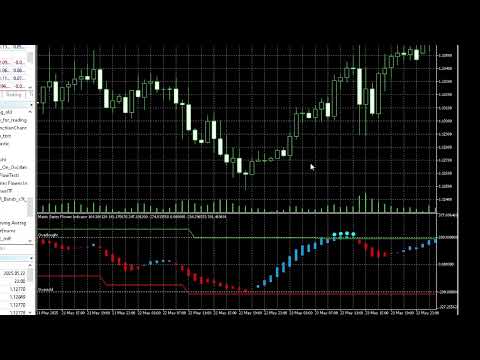
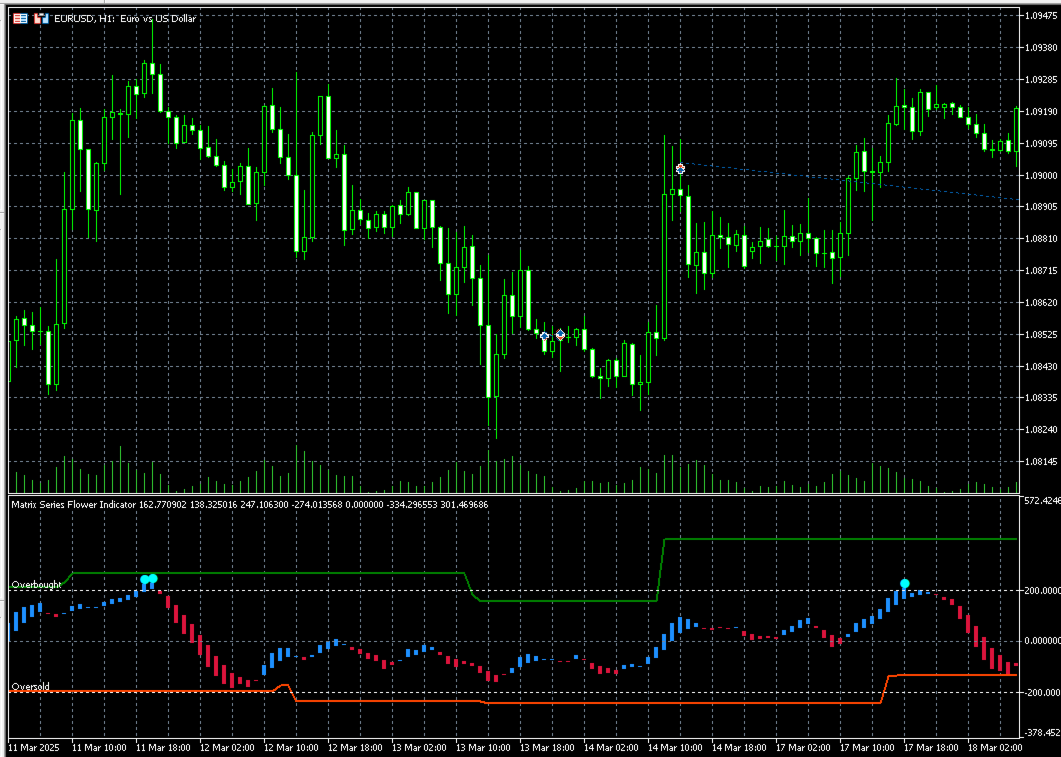
L'indicatore Flower è un indicatore di trend basato sull'analisi tecnica e sulla dinamica dei prezzi. Segnala visivamente i trend utilizzando fiori colorati: i fiori blu indicano un trend rialzista, mentre i fiori rossi indicano un trend ribassista.
Ogni livello può fungere da supporto e resistenza (osservare i livelli +/- 200 e i punti quando compaiono sul grafico).
È possibile impostare i punti in modo che appaiano quando superano i livelli statici di ipercomprato/ipervenduto, o le bande associate, entrambi o uno qualsiasi di essi.
Questo indicatore individua una potenziale inversione del mercato identificando le zone di accumulazione/distribuzione. È compatibile con qualsiasi strumento e timeframe; i parametri devono essere adattati a piacimento. Ogni livello può fungere da supporto e resistenza.

Полная ерунда