RSI Ultimate MTF

5

1. Introduction

The CM_Ultimate_RSI_MTF is a powerful and versatile custom indicator for MetaTrader 5, designed to enhance your Relative Strength Index (RSI) analysis. It provides multi-timeframe (MTF) capabilities, visual signals, and customizable alerts, making it an invaluable tool for traders seeking to identify overbought/oversold conditions, trend strength, and potential entry/exit points across various timeframes.

2. Key Features

  • Multi-Timeframe (MTF) Analysis: Allows you to view RSI from a different timeframe directly on your current chart.
  • Dual RSI Plots: Option to display a second RSI with its own customizable settings and timeframe.
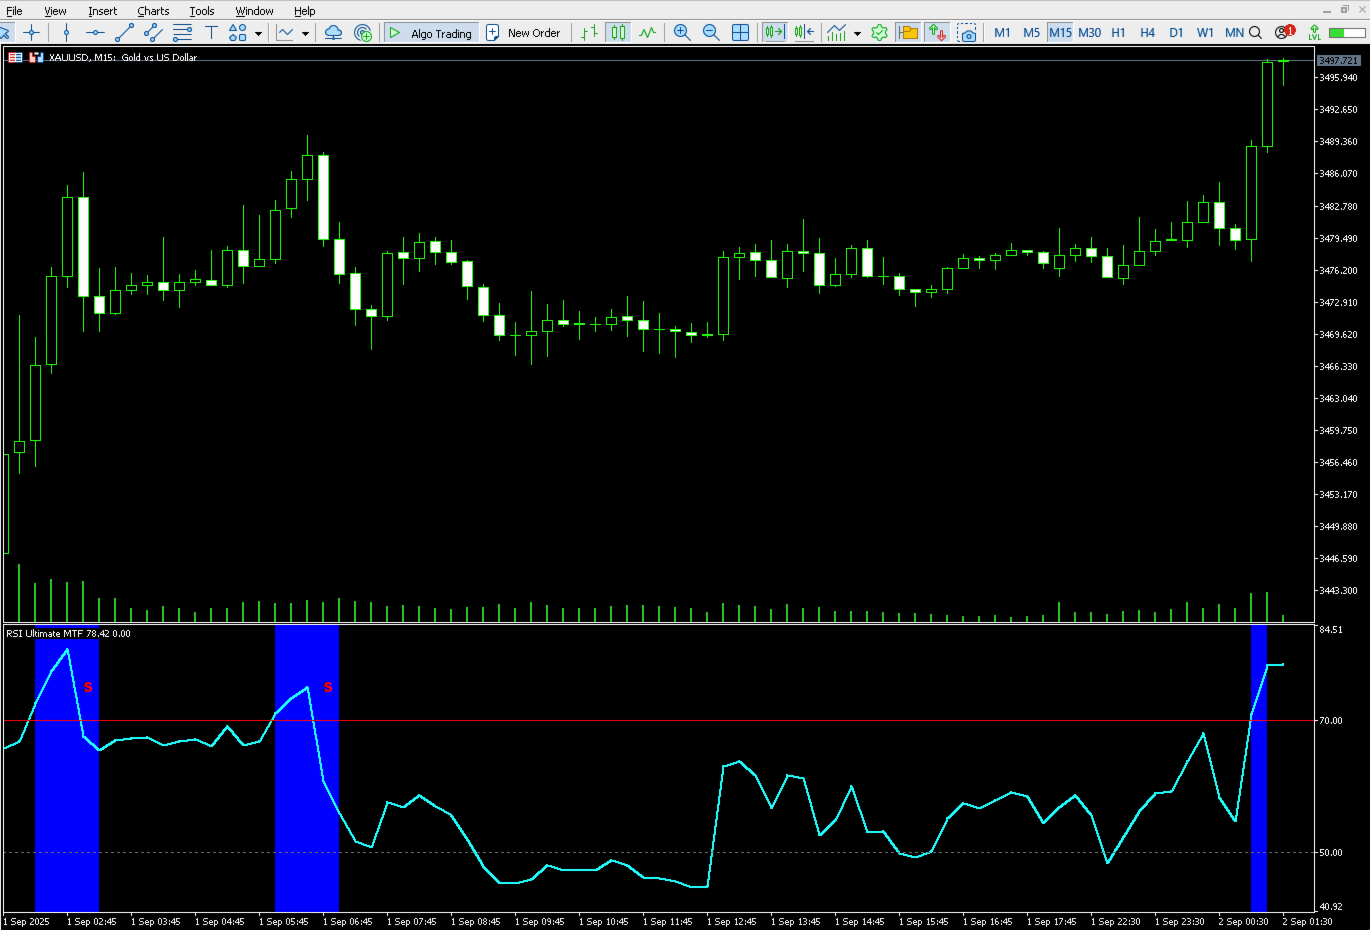
  • Visual Overbought/Oversold Highlights: Background coloring to easily identify when RSI is above the Upper Line or below the Lower Line.
  • Cross Highlights: Visual cues when RSI crosses the Upper or Lower Lines.
  • Buy/Sell Signal Letters: Clear 'B' (Buy) and 'S' (Sell) letters plotted on the indicator window for cross signals.
  • Customizable Alerts: Receive notifications (popup, sound, push, email) when RSI generates a cross signal.

3. How it Works

The indicator calculates the Relative Strength Index (RSI), a momentum oscillator that measures the speed and change of price movements. RSI values range from 0 to 100. Traditionally, readings above 70 indicate overbought conditions, and readings below 30 indicate oversold conditions.

  • Multi-Timeframe Functionality: The core strength of this indicator lies in its ability to display RSI from a timeframe different from your current chart. This allows for higher-timeframe trend confirmation or lower-timeframe entry timing without switching charts.
  • Signal Generation:
    • Overbought/Oversold: When the main RSI crosses above the UpperLine (e.g., 70) or below the LowerLine (e.g., 30), the background of the indicator window changes color, indicating potential overbought or oversold conditions.
    • Cross Signals: When the main RSI crosses down through the UpperLine or up through the LowerLine , an 'S' (Sell) or 'B' (Buy) letter is plotted, respectively. These crosses also trigger background highlights and customizable alerts.
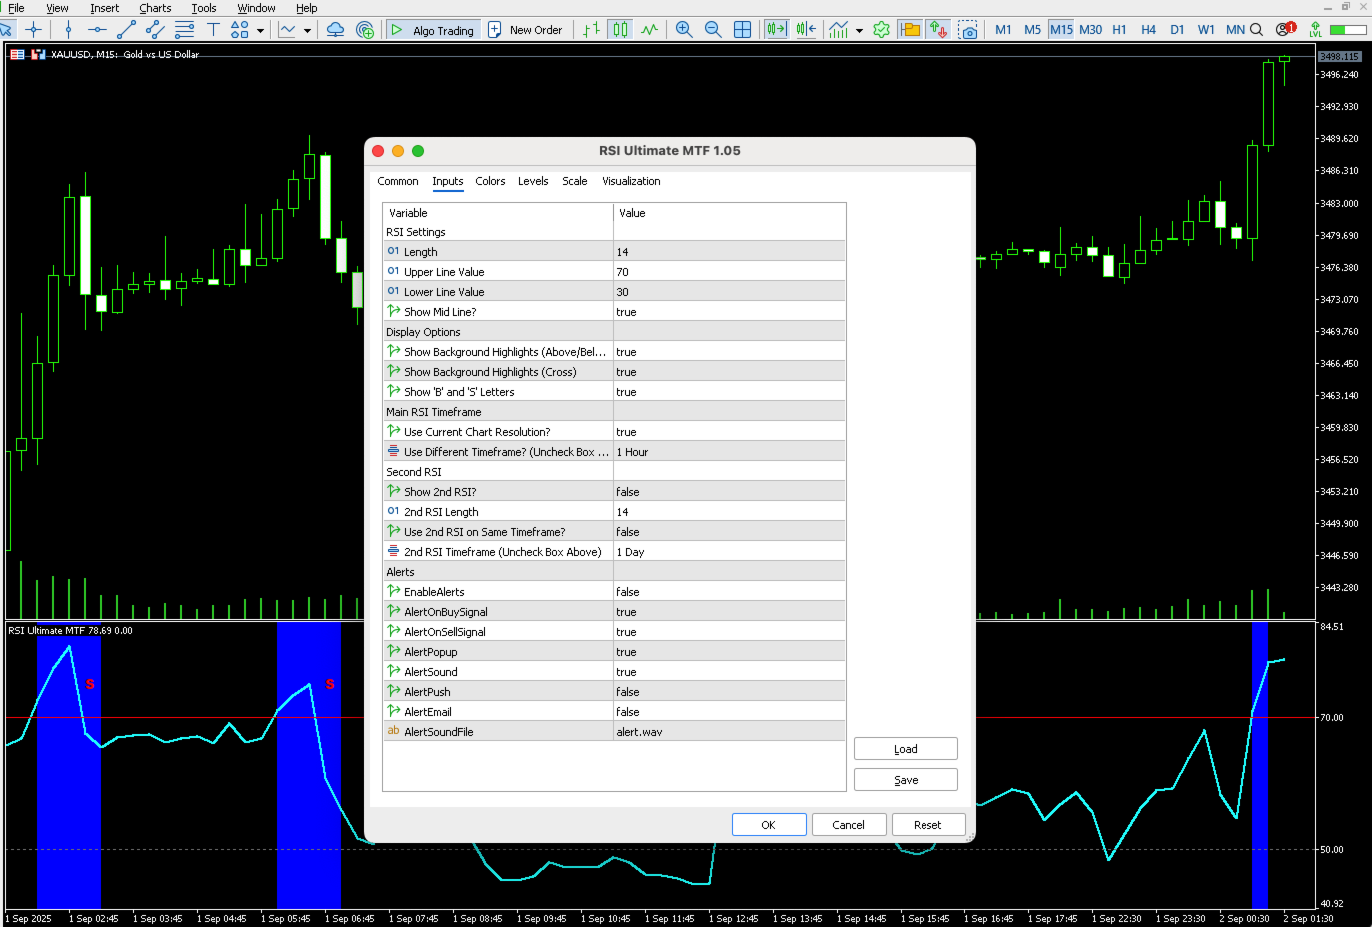
4. Input Parameters

The CM_Ultimate_RSI_MTF indicator offers extensive customization through its input parameters:

RSI Settings

  • RsiLength : The period used for the main RSI calculation (default: 14).
  • UpperLine : The upper threshold value for RSI (default: 70).
  • LowerLine : The lower threshold value for RSI (default: 30).
  • ShowMidLine : Enable/disable the display of the 50-level midline (default: true).

Display Options

  • ShowBGHighlights : Enable/disable background highlights for overbought/oversold conditions (default: true).
  • ShowCrossHighlights : Enable/disable background highlights when RSI crosses the Upper/Lower Lines (default: true).
  • ShowSignalLetters : Enable/disable the 'B' and 'S' signal letters (default: true).

Main RSI Timeframe

  • UseCurrentTF : If true, the main RSI will use the current chart's timeframe. If false, CustomTF will be used (default: true).
  • CustomTF : Allows you to select a specific timeframe for the main RSI if UseCurrentTF is false (default: PERIOD_H1 - 1 Hour).

Second RSI

  • ShowSecondRSI : Enable/disable the display of a second RSI plot (default: false).
  • RsiLength2 : The period for the second RSI calculation (default: 14).
  • UseCurrentTF2 : If true, the second RSI will use the current chart's timeframe. If false, CustomTF2 will be used (default: false).
  • CustomTF2 : Allows you to select a specific timeframe for the second RSI if UseCurrentTF2 is false (default: PERIOD_D1 - 1 Day).

Alerts

  • EnableAlerts : Master switch to enable/disable all alerts (default: false).
  • AlertOnBuySignal : Enable/disable alerts for Buy signals (RSI crosses up Lower Line) (default: true).
  • AlertOnSellSignal : Enable/disable alerts for Sell signals (RSI crosses down Upper Line) (default: true).
  • AlertPopup : Enable/disable popup alerts (default: true).
  • AlertSound : Enable/disable sound alerts (default: true).
  • AlertPush : Enable/disable push notifications to your mobile device (requires MetaTrader mobile app setup) (default: false).
  • AlertEmail : Enable/disable email alerts (requires MetaTrader email setup) (default: false).
  • AlertSoundFile : The sound file to play for alerts (e.g., "alert.wav") (default: "alert.wav").

5. How to Use in Trading

The CM_Ultimate_RSI_MTF indicator is a versatile tool that can be integrated into various trading strategies. Here are some common applications:

  • Identifying Overbought/Oversold Conditions:

    • When RSI enters the overbought zone (above UpperLine ), it suggests that the asset may be due for a price correction or reversal downwards.
    • When RSI enters the oversold zone (below LowerLine ), it suggests that the asset may be due for a price correction or reversal upwards.
    • Application: Look for 'S' signals (RSI crossing down from overbought) for potential sell opportunities, and 'B' signals (RSI crossing up from oversold) for potential buy opportunities.
  • Trend Confirmation (using MTF):

    • Use the main RSI on your trading timeframe (e.g., H1) and the second RSI on a higher timeframe (e.g., H4 or Daily).
    • Application: In an uptrend, ensure the higher timeframe RSI is also showing bullish momentum (e.g., above 50 or rising) before taking buy signals on the lower timeframe. Conversely, in a downtrend, ensure the higher timeframe RSI is bearish before taking sell signals.
  • Entry/Exit Signals:

    • Buy Signal: A 'B' letter appears when RSI crosses up through the LowerLine . This can be used as a potential entry point for long positions.
    • Sell Signal: An 'S' letter appears when RSI crosses down through the UpperLine . This can be used as a potential entry point for short positions or an exit point for long positions.
    • Refinement: Combine these signals with price action, support/resistance levels, or other indicators for higher probability setups.
  • Filtering Signals:

    • If the main RSI is in an overbought zone, you might choose to ignore buy signals and only look for sell signals.
    • If the main RSI is in an oversold zone, you might choose to ignore sell signals and only look for buy signals.

6. Important Disclaimer

Trading foreign exchange on margin carries a high level of risk, and may not be suitable for all investors. The high degree of leverage can work against you as well as for you. Before deciding to trade foreign exchange, you should carefully consider your investment objectives, level of experience, and risk appetite. The possibility exists that you could sustain a loss of some or all of your initial investment and therefore you should not invest money that you cannot afford to lose. You should be aware of all the risks associated with foreign exchange trading, and seek advice from an independent financial advisor if you have any doubts.

The CM_Ultimate_RSI_MTF indicator is an analytical tool designed to assist in market analysis and decision-making. It does not guarantee profits or predict future market movements with certainty. All trading decisions remain solely your responsibility. Past performance is not indicative of future results.

Recensioni 1
Findolin
1970
Findolin 2025.09.29 09:25 
 

Ein sehr gut durchdachter Indikator, mit dem zu arbeiten richtig Freude macht. Vielen Dank!

Prodotti consigliati
Trend Range Indicator
Claudius Marius Walter
5 (1)
Introduction Poppsir is a trend-range indicator for metatrader 5 (for now), which distinguishes sideways phases from trend phases. With this tool it is possible to design a trend following-, meanreversion-, as well as a breakout strategy. This indicator does not repaint! The signal of the Poppsir indicator is quite easy to determine. As soon as the RSI and Popsir change their respective color to gray, a breakout takes place or in other words, the sideways phase has ended. Interpretation
FREE
Description The Institutional Cycle Filter (ICF) is a sophisticated trend-following tool that replaces standard moving averages with a "Signal Dot" system. It is designed to minimize lag while maintaining smoothness, making it highly effective for identifying trend reversals in volatile markets like Gold. How It Works (The Logic) Cosine Weighting: Unlike a Simple Moving Average (SMA) or Exponential Moving Average (EMA), this algorithm uses a Cosine function to calculate weights. This allows the
FREE
DRX SPREAD MONITOR è un'utility professionale progettata per visualizzare e analizzare gli spread dei broker in tempo reale. Aiuta i trader a identificare i costi nascosti causati dall'ampliamento dello spread durante eventi di notizie, rollover o sessioni a bassa liquidità. Questo strumento è essenziale per gli Scalper e i trader su Oro che devono garantire la qualità dell'esecuzione ed evitare di entrare a mercato quando i costi di trading sono statisticamente troppo alti. Caratteristiche Prin
FREE
Timeframe Simulator Indicator This indicator redraws candlestick structures from a higher timeframe onto your current chart. It helps visualize higher-period price action without switching timeframes, making it easier to analyze trends and key levels while trading on lower timeframes. Main features: Customizable Candles   – Adjust the appearance of higher timeframe candles (bull/bear colors, wick style, gaps, and history length). Higher Timeframe Lines   – Optionally display dynamic high, low,
FREE
Dynamic Supply and Demand indicator automatically identifies and displays Supply and Demand Zones on your chart based on price action patterns and market structure.  These zones represent areas where institutional buying or selling pressure has historically occurred, making them key levels for potential price reactions. This form of indicator takes inspiration from ICT as well as traditional Support & Resistance formation. **For the first 50 candles (number depends on LookBackCandles) when indic
FREE
Smart Trend Suite Pro – Advanced Trend Indicator with Dashboard & Alerts Overview: Smart Trend Suite Pro is a powerful trend-detection indicator that offers traders a complete set of tools for accurate trend analysis and actionable insights. Designed for versatility and precision, Smart Trend Suite Pro adapts seamlessly to multiple timeframes and market conditions, making it suitable for various trading styles, including scalping and swing trading. Key Features: Real-Time Trend Detection: Identi
FREE
FusionAlert StochRSI Master is an indicator available for MT4/MT5 platforms, it is a combination of RSI & Stochastic indicator which provide "alerts" when the market is inside "overbought and oversold" regions combined for both indicators, results in more precise and accurate signals to be used as a wonderful tool, in the form of "buy or sell" signals. This indicator comes with many customization options mentioned in the parameter section below, user can customise these parameters as needful. Jo
FREE
Show Pips for MT5
Roman Podpora
4.52 (27)
Questo indicatore informativo sarà utile per coloro che vogliono essere sempre informati sulla situazione attuale del conto. VERSION MT 4 -   More useful indicators L'indicatore mostra dati come profitto in punti, percentuale e valuta, nonché lo spread per la coppia corrente e il tempo fino alla chiusura della barra nell'intervallo di tempo corrente. Esistono diverse opzioni per posizionare la linea delle informazioni sulla carta: A destra del prezzo (corre dietro al prezzo); Come commento (nell
FREE
CLICK HERE TO JOIN OUR WHATSAPP GROUP. This trading indicator Automatically identifies and plots contract blocks, which are essential zones marked by significant levels of support and resistance. This powerful tool provides traders with a clear and intuitive visualization of critical market points where prices are likely to bounce or reverse. The contract blocks, represented by distinct colored rectangles, highlight support zones (at the bottom) and resistance zones (at the top), enabling trad
FREE
PZ Three Drives MT5
PZ TRADING SLU
2.83 (6)
This indicator finds Three Drives patterns. The Three Drives pattern is a 6-point reversal pattern characterised by a series of higher highs or lower lows that complete at a 127% or 161.8% Fibonacci extension. It signals that the market is exhausted and a reversal can happen. [ Installation Guide | Update Guide | Troubleshooting | FAQ | All Products ] Customizable pattern sizes Customizable colors and sizes Customizable breakout periods Customizable 1-2-3 and 0-A-B ratios It implements visual/s
FREE
Indicator and Expert Adviser  EA Available in the comments section of this product. Download with Indicator must have indicator installed for EA to work. Mt5 indicator alerts for bollinger band and envelope extremes occurring at the same time. Buy signal alerts occur when A bullish candle has formed below both the lower bollinger band and the lower envelope  Bar must open and close below both these indicators. Sell signal occur when A bear bar is formed above the upper bollinger band and upper
FREE
VWAP Level MT5
Francesco Lenza
4.5 (2)
The VWAP Level indicator is a technical analysis tool that calculates the weighted average price for the traded volumes of a specific asset. The VWAP provides traders and investors with the average price of an asset over a specific time frame. It is commonly used by investors to compare data on "passive" trading operations, such as pension funds and mutual funds, but also by traders who want to check if an asset has been bought or sold at a good market price. To calculate the VWAP level we us
FREE
Trading Sessions by Mahefa R is an indicator for MetaTrader 5 that visually identifies the four main trading sessions: New York, London, Tokyo, and Sydney . Designed to provide a clean, intuitive, and professional market view, it highlights the most active periods of the Forex market using smart visualization of session ranges , session-specific candle colors , and daily separators . Main Features: Automatic detection of the 4 major sessions New York London Tokyo Sydney Each session is fully c
FREE
The indicator identifies when a divergence occurs between price and an indicator or oscillator. It identifies both regular and hidden divergences. Combined with your own rules and techniques, this indicator will allow you to create (or enhance) your own powerful system. For higher probability setups I can recommend you to use my Supply Demand indicator and trade only if the divergence occurs inside a zone. Supply zone for bearish div and demand zone for bullish div. The optimal scenario is if it
FREE
Automatic Trendlines
Pasi Hakamaki
4.69 (48)
The indicator draws trendlines on chart. This indicator has six inputs. User can specify alternative labels for both lines. If multiple instances of the indicator are used, the labels must differ. User can set width and color of the lines and depth which specifies what significant peaks should be used. For example, Depth=10 sets trendlines using the current peaks and valleys that have at least 10 bars to the right and to the left and that have highs/lows less/greater than the peak's high/low. In
FREE
Statistical Arbitrage Spread Generator for Cointegration [MT5] What is Pair Trading? Pair trading is a market-neutral strategy that looks to exploit the relative price movement between two correlated assets — instead of betting on the direction of the market. The idea? When two assets that usually move together diverge beyond a statistically significant threshold, one is likely mispriced. You sell the expensive one, buy the cheap one , and profit when they converge again. It’s a statistica
FREE
MWC Ratio 5
Joerg Hamann
2 (2)
The Commitments of Traders Ratio Indicator is one of these things you never thought about it before you really see the magic behind it. The indicator shows the Ratio of long/short positions released by the CFTC once a week. If you have a look on the Sreenshot you can see two (three) zones of interest. Important note: MAs are not available in version 1.0. Zone 1: The Switches (Red -> Green, Green -> Red) Zone 2: MA cross Zone 3: If you combine this with the COX indicator an additional zone will
FREE
Girassol Sunflower MT5 Indicator
Saullo De Oliveira Pacheco
4.33 (6)
This is the famous Sunflower indicator for Metatrader5. This indicator marks possible tops and bottoms on price charts. The indicator identifies tops and bottoms in the asset's price history, keep in mind that the current sunflower of the last candle repaints, as it is not possible to identify a top until the market reverses and it is also not possible to identify a bottom without the market stop falling and start rising. If you are looking for a professional programmer for Metatrader5, please
FREE
RSI divergence indicator finds divergences between price chart and   RSI   indicator and informs you with alerts (popup, mobile notification or email). Its main use is to find trend reversals in the chart. Always use the divergence indicators with other technical assets like support resistance zones, candlestick patterns and price action to have a higher possibility to find trend reversals. Three confirmation type for   RSI   divergences: RSI   line cross 50 level Price returns to previous H/L C
FREE
MA Color Candles Indicator MA Color Candles is an indicator for visually displaying market trends by coloring chart candles. It does not add objects or distort price data, instead coloring real candles based on the state of two moving averages. This enables quick trend assessment and use as a filter in trading strategies. How It Works Bullish trend: Fast MA above slow MA, slow MA rising (green candles). Bearish trend: Fast MA below slow MA, slow MA falling (red candles). Neutral state: Candles
FREE
https://www.mql5.com/en/users/gedeegi/seller   GEN (Trend Fib Zones) GEN (Trend Fib Zones) is a professional technical analysis indicator that automatically detects trend structure shifts using swing highs/lows and dynamically plots key Fibonacci retracement and extension zones. Key Features: Automatic Trend Structure Detection Identifies market structure changes using CHoCH (Change of Character) and BOS (Break of Structure) logic. Highlights trend direction based on real swing high/low pivo
FREE
HA Trend Flow is a professional two-stage smoothed Heiken Ashi trend indicator for MetaTrader 5. It is designed to clearly visualize market trends , reduce noise and reliably identify sideways market phases – without repainting. Ideal for trend traders, scalpers, swing traders and multi-timeframe analysis . Key Benefits Much smoother trends compared to standard Heiken Ashi 2-stage smoothing (OHLC + Heiken Ashi) Automatic sideways / chop detection Clear neutral & doji candle identificat
FREE
Pivot Points Indicator – a fast, reliable, and fully customizable pivot detection for MetaTrader 5. This indicator uses MetaTrader’s native iHighest and iLowest functions to identify pivot highs and lows by scanning for the highest and lowest prices within a user-defined window of bars. A pivot is confirmed only when the current bar is the absolute maximum or minimum within the selected range, ensuring accurate and timely signals based on robust built-in logic. Key Features No Repainting : Onc
FREE
SuperTrend Indicator – Description & Important Notice The SuperTrend is a composite technical indicator designed to help you identify the primary trend, measure its strength, and assess signal quality. However, an indicator is only a tool —it’s never 100% accurate and cannot replace sound risk management. 1. Core Formula & Components ATR (Average True Range): measures price volatility; customize sensitivity via Periods and Multiplier . Upper/Lower Bands: derived from ATR and your chosen source p
FREE
Migliora il tuo trading di price action con l'indicatore Higher Highs and Lows MT5, uno strumento robusto che sfrutta l'analisi frattale per individuare punti di swing chiave e identificare pattern che definiscono il trend come Higher Highs (HH), Lower Highs (LH), Lower Lows (LL) e Higher Lows (HL) per insight chiari sulla direzione del mercato. Tratto dai principi fondamentali di price action radicati nella Teoria di Dow dei primi del 1900 e popolari nel trading moderno da esperti come Al Brook
FREE
Fair Value Gap Zone
Mattia Impicciatore
Descrizione Generale Il Fair Gap Value Indicator individua e mette in evidenza i “fair value gap” sul grafico di MetaTrader 5. Un fair gap si crea quando tra il minimo di una barra e il massimo di un’altra, separate da una barra intermedia, si forma un vuoto di prezzo. L’indicatore disegna rettangoli colorati (rialzisti e ribassisti) per evidenziare queste aree, offrendo un valido supporto visivo nelle strategie di price action. Principali Caratteristiche Rilevamento gap rialzisti : evidenzia ga
FREE
Magic 7 Indicator
Marek Pawel Szczesny
5 (1)
Overview Magic 7 Indicator is a comprehensive MetaTrader 5 (MQL5) indicator that identifies seven different trading scenarios based on candlestick patterns and technical analysis. The indicator combines traditional price action patterns with modern concepts like Fair Value Gaps (FVG) to provide trading signals with precise entry points and stop loss levels. Features 7 Trading Scenarios : Each scenario identifies specific market conditions and trading opportunities Visual Signals : Clear buy/sell
FREE
Breakout Shift Trader – MT5 Indicator Trade Like the Market Architects — Not the Victims. Most traders are fighting blind against a rigged game. Market makers engineer false breakouts, liquidity grabs, and “stop hunts” that wipe out retail accounts in seconds. Breakout Shift Trader flips the script. This MT5 indicator decodes the footprints left by institutional manipulation and aligns your trades with the power brokers driving real price action. Proven Results – Tested, Verified, Relentless N
FREE
Virtual Targets MT5
Hoang Van Dien
4.63 (8)
This indicator is very useful for day traders or short term traders. (MT5 version) No need to calculate the number of pips manually, just look at the chart and you will see the Virtual Take Profit / Virtual Stop Loss target line and evaluate whether the entry point is feasible to reach the intended target or not. Enter the intended   Take Profit / Stop Loss   pips for your trade. The indicator will display   Virtual Take Profit / Virtual Stop Loss   lines for you to easily see if the target is
FREE
Gli utenti di questo prodotto hanno anche acquistato
FX Trend MT5 NG
Daniel Stein
5 (3)
FX Trend NG: La Nuova Generazione di Intelligenza di Trend Multi-Mercato Panoramica FX Trend NG è uno strumento professionale di analisi del trend multi-timeframe e monitoraggio dei mercati. Ti consente di comprendere la struttura completa del mercato in pochi secondi. Invece di passare tra numerosi grafici, puoi identificare immediatamente quali strumenti sono in trend, dove il momentum sta diminuendo e dove esiste un forte allineamento tra i timeframe. Offerta di Lancio – Ottieni FX Trend NG
Se acquisti questo indicatore, riceverai il mio Trade Manager Professionale + EA  GRATUITAMENTE. Innanzitutto è importante sottolineare che questo sistema di trading è un indicatore Non-Repainting, Non-Redrawing e Non-Lagging, il che lo rende ideale sia per il trading manuale che per quello automatico. Corso online, manuale e download di preset. Il "Sistema di Trading Smart Trend MT5" è una soluzione completa pensata sia per i trader principianti che per quelli esperti. Combina oltre 10 indicat
SuperScalp Pro
Van Minh Nguyen
5 (4)
SuperScalp Pro – Sistema avanzato di indicatore per scalping con filtri multipli SuperScalp Pro è un sistema avanzato di indicatore per scalping che combina il classico Supertrend con molteplici filtri di conferma intelligenti. L’indicatore funziona in modo efficiente su tutti i timeframe da M1 a H4 ed è particolarmente adatto per XAUUSD, BTCUSD e le principali coppie Forex. Può essere utilizzato come sistema stand-alone o integrato in modo flessibile nelle strategie di trading esistenti. L’indi
Divergence Bomber
Ihor Otkydach
4.89 (81)
Ogni acquirente dell’indicatore riceverà inoltre gratuitamente: L’utilità esclusiva “Bomber Utility”, che gestisce automaticamente ogni operazione, imposta i livelli di Stop Loss e Take Profit e chiude le posizioni secondo le regole della strategia I file di configurazione (set file) per adattare l’indicatore a diversi asset I set file per configurare il Bomber Utility in tre modalità: “Rischio Minimo”, “Rischio Bilanciato” e “Strategia di Attesa” Una guida video passo-passo per installare, conf
ARIPoint
Temirlan Kdyrkhan
ARIPoint is a powerful trading companion designed to generate high-probability entry signals with dynamic TP/SL/DP levels based on volatility. Built-in performance tracking shows win/loss stats, PP1/PP2 hits, and success rates all updated live. Key Features: Buy/Sell signals with adaptive volatility bands Real-time TP/SL/DP levels based on ATR Built-in MA Filter with optional ATR/StdDev volatility Performance stats panel (Success, Profit/Loss, PP1/PP2) Alerts via popup, sound, push, or email Cu
Entry In The Zone and SMC Multi Timeframe is a real-time market analysis tool developed based on Smart Money Concepts (SMC). It is designed to analyze market structure, price direction, reversal points, and key zones across multiple timeframes in a systematic way. The system displays Points of Interest (POI) and real-time No Repaint signals, with instant alerts when price reaches key zones or when signals occur within those zones. It functions as both an Indicator and a Signal System (2-in-1), c
Super Signal – Skyblade Edition Sistema professionale di segnali di tendenza senza repaint / senza ritardo con tasso di vincita eccezionale | Per MT4 / MT5 Funziona meglio su timeframe più bassi, come 1 minuto, 5 minuti e 15 minuti. Caratteristiche principali: Super Signal – Skyblade Edition è un sistema intelligente di segnali progettato specificamente per il trading di tendenza. Utilizza una logica di filtraggio multilivello per identificare esclusivamente i movimenti direzionali forti, supp
Azimuth Pro
Ottaviano De Cicco
5 (4)
LAUNCH PROMO Azimuth Pro price is initially set at 299$ for the first 100 buyers. Final price will be 499$ . THE DIFFERENCE BETWEEN RETAIL AND INSTITUTIONAL ENTRIES ISN'T THE INDICATOR — IT'S THE LOCATION. Most traders enter at arbitrary price levels, chasing momentum or reacting to lagging signals. Institutions wait for price to reach structured levels where supply and demand actually shift. Azimuth Pro maps these levels automatically: swing-anchored VWAP, multi-timeframe structure lines, an
Power Candles MT5
Daniel Stein
5 (6)
Power Candles – Segnali di ingresso basati sulla forza per tutti i mercati Power Candles porta l’analisi di forza collaudata di Stein Investments direttamente sul grafico dei prezzi. Invece di reagire solo al prezzo, ogni candela viene colorata in base alla reale forza di mercato, consentendo di identificare immediatamente accumuli di momentum, accelerazioni della forza e transizioni di trend pulite. Un’unica logica per tutti i mercati Power Candles funziona automaticamente su tutti i simboli di
Game Changer Indicator mt5
Vasiliy Strukov
4.79 (19)
Game Changer è un indicatore di tendenza rivoluzionario, progettato per essere utilizzato su qualsiasi strumento finanziario, per trasformare il tuo MetaTrader in un potente analizzatore di trend. Funziona su qualsiasi intervallo temporale e aiuta a identificare i trend, segnala potenziali inversioni, funge da meccanismo di trailing stop e fornisce avvisi in tempo reale per risposte tempestive del mercato. Che tu sia un professionista esperto o un principiante in cerca di un vantaggio, questo st
Atomic Analyst MT5
Issam Kassas
4.07 (28)
Innanzitutto, vale la pena sottolineare che questo indicatore di trading non è repaint, non è ridisegno e non presenta ritardi, il che lo rende ideale sia per il trading manuale che per quello automatico. Manuale utente: impostazioni, input e strategia. L'Analista Atomico è un indicatore di azione del prezzo PA che utilizza la forza e il momentum del prezzo per trovare un miglior vantaggio sul mercato. Dotato di filtri avanzati che aiutano a rimuovere rumori e segnali falsi, e aumentare il pote
FX Power MT5 NG
Daniel Stein
5 (31)
FX Power: Analizza la Forza delle Valute per Decisioni di Trading Più Intelligenti Panoramica FX Power è lo strumento essenziale per comprendere la reale forza delle principali valute e dell'oro in qualsiasi condizione di mercato. Identificando le valute forti da comprare e quelle deboli da vendere, FX Power semplifica le decisioni di trading e rivela opportunità ad alta probabilità. Che tu segua le tendenze o anticipi inversioni utilizzando valori estremi di Delta, questo strumento si adatta
Trend Screener Pro MT5
STE S.S.COMPANY
4.84 (100)
Indicatore di tendenza, soluzione unica rivoluzionaria per il trading di tendenze e il filtraggio con tutte le importanti funzionalità di tendenza integrate in un unico strumento! È un indicatore multi-timeframe e multi-valuta al 100% non ridipingibile che può essere utilizzato su tutti i simboli/strumenti: forex, materie prime, criptovalute, indici e azioni. Trend Screener è un indicatore di tendenza che segue un indicatore efficiente che fornisce segnali di tendenza a freccia con punti nel gra
Top indicator for MT5   providing accurate signals to enter a trade without repainting! It can be applied to any financial assets:   forex, cryptocurrencies, metals, stocks, indices .  Watch  the video  (6:22) with an example of processing only one signal that paid off the indicator! MT4 version is here It will provide pretty accurate trading signals and tell you when it's best to open a trade and close it. Most traders improve their trading results during the first trading week with the help of
Gold Entry Sniper
Tahir Mehmood
5 (4)
Gold Entry Sniper – Dashboard ATR Multi-Timeframe per Scalping e Swing Trading sull’Oro Gold Entry Sniper è un indicatore avanzato per MetaTrader 5 che offre segnali di acquisto/vendita precisi per XAUUSD e altri strumenti, basato sulla logica ATR Trailing Stop e l' analisi multi-timeframe . Caratteristiche e Vantaggi Analisi Multi-Timeframe – Visualizza trend su M1, M5, M15 in un'unica dashboard. Trailing Stop Basato su ATR – Stop dinamici che si adattano alla volatilità. Dashboard Professional
Smart Stop Indicator – Precisione intelligente dello stop-loss direttamente sul grafico Panoramica Smart Stop Indicator è la soluzione ideale per i trader che desiderano posizionare il loro stop-loss in modo chiaro e metodico, senza dover indovinare o affidarsi all’intuizione. Questo strumento combina la logica classica del price action (massimi e minimi strutturali) con un moderno riconoscimento dei breakout per identificare il prossimo livello di stop realmente logico. In trend, in range o i
Ogni giorno, molti trader affrontano una sfida comune: il prezzo sembra rompere un livello chiave, entrano in un'operazione, e poi il mercato si inverte, attivando il loro stop loss. Questo è noto come falsa rottura (false breakout) — un movimento di prezzo che supera brevemente un livello di supporto o resistenza prima di invertire la direzione. Questi movimenti possono causare l'attivazione degli stop loss prima che la direzione effettiva del prezzo diventi chiara. Nell'analisi tecnica, questo
Trend indicator AI mt5
Ramil Minniakhmetov
5 (15)
Trend Ai indicator è un ottimo strumento che migliorerà l'analisi di mercato di un trader combinando l'identificazione della tendenza con punti di ingresso utilizzabili e avvisi di inversione. Questo indicatore consente agli utenti di navigare nelle complessità del mercato forex con fiducia e precisione Oltre ai segnali primari, l'indicatore Ai di tendenza identifica i punti di ingresso secondari che si presentano durante i pullback o i ritracciamenti, consentendo ai trader di capitalizzare le
Quantum TrendPulse
Bogdan Ion Puscasu
5 (20)
Ecco   Quantum TrendPulse   , lo strumento di trading definitivo che combina la potenza di   SuperTrend   ,   RSI   e   Stocastico   in un unico indicatore completo per massimizzare il tuo potenziale di trading. Progettato per i trader che cercano precisione ed efficienza, questo indicatore ti aiuta a identificare con sicurezza le tendenze di mercato, i cambiamenti di momentum e i punti di entrata e uscita ottimali. Caratteristiche principali: Integrazione SuperTrend:   segui facilmente l'andame
FX Levels MT5
Daniel Stein
5 (13)
FX Levels: Supporti e Resistenze di Precisione Eccezionale per Tutti i Mercati Panoramica Rapida Cercate un modo affidabile per individuare livelli di supporto e resistenza in ogni mercato—coppie di valute, indici, azioni o materie prime? FX Levels fonde il metodo tradizionale “Lighthouse” con un approccio dinamico all’avanguardia, offrendo una precisione quasi universale. Basato sulla nostra esperienza reale con i broker e su aggiornamenti automatici giornalieri più quelli in tempo reale, FX
LINEE DI TENDENZA PRO  Aiuta a capire dove il mercato sta realmente cambiando direzione. L'indicatore mostra reali inversioni di tendenza e punti in cui i principali operatori rientrano. Vedi   Linee BOS   Cambiamenti di tendenza e livelli chiave su timeframe più ampi, senza impostazioni complesse o rumore inutile. I segnali non vengono ridisegnati e rimangono sul grafico dopo la chiusura della barra. VERSIONE MT4   -   Svela il suo massimo potenziale se abbinato all'indicatore   RFI LEVELS PRO
Crystal Heikin Ashi Signals - Professional Trend & Signal Detection Indicator Advanced Heikin Ashi Visualization with Intelligent Signal System for Manual & Automated Trading Final Price: $149 ---------> Price goes up $10 after every 10 sales . Limited slots available — act fast . Overview Crystal Heikin Ashi Signals is a professional-grade MetaTrader 5 indicator that combines pure Heikin Ashi candle visualization with an advanced momentum-shift detection system. Designed for both manual traders
Pointer Trend Switch — precision trend reversal indicator Pointer Trend Switch is a high-precision arrow indicator designed to detect key moments of trend reversal based on asymmetric price behavior within a selected range of bars. It identifies localized price impulses by analyzing how far price deviates from the opening level, helping traders find accurate entry points before a trend visibly shifts. This indicator is ideal for scalping, intraday strategies, and swing trading, and performs equa
Grabber System MT5
Ihor Otkydach
4.82 (22)
Ti presento un eccellente indicatore tecnico: Grabber, che funziona come una strategia di trading "tutto incluso", pronta all’uso. In un solo codice sono integrati strumenti potenti per l’analisi tecnica del mercato, segnali di trading (frecce), funzioni di allerta e notifiche push. Ogni acquirente di questo indicatore riceve anche gratuitamente: L’utility Grabber: per la gestione automatica degli ordini aperti Video tutorial passo dopo passo: per imparare a installare, configurare e utilizzare
Presentazione       Quantum Breakout PRO   , l'innovativo indicatore MQL5 che sta trasformando il modo in cui scambi le zone di breakout! Sviluppato da un team di trader esperti con un'esperienza di trading di oltre 13 anni,       Quantum Breakout PRO       è progettato per spingere il tuo viaggio di trading a nuovi livelli con la sua strategia innovativa e dinamica della zona di breakout. Quantum Breakout Indicator ti fornirà frecce di segnalazione sulle zone di breakout con 5 zone target di
L'indicatore " Dynamic Scalper System MT5 " è progettato per il metodo di scalping, ovvero per il trading all'interno di onde di trend. Testato sulle principali coppie di valute e sull'oro, è compatibile con altri strumenti di trading. Fornisce segnali per l'apertura di posizioni a breve termine lungo il trend, con ulteriore supporto al movimento dei prezzi. Il principio dell'indicatore. Le frecce grandi determinano la direzione del trend. Un algoritmo per generare segnali per lo scalping sott
L’indicatore evidenzia le zone in cui viene dichiarato interesse sul mercato , per poi mostrare la zona di accumulo degli ordini . Funziona come un book degli ordini su larga scala . Questo è l’indicatore per i grandi capitali . Le sue prestazioni sono eccezionali. Qualsiasi interesse ci sia nel mercato, lo vedrai chiaramente . (Questa è una versione completamente riscritta e automatizzata – non è più necessaria un’analisi manuale.) La velocità di transazione è un indicatore concettualmente nuo
TrendMaestro5
Stefano Frisetti
Attenzione alle truffe, questo indicatore e' distribuito esclusivamente su MQL5.com nota: questo indicatore e' per METATRADER5, se vuoi la versione per  METATRADER4 questo e' il link:   https://www.mql5.com/it/market/product/108106 TRENDMAESTRO ver 2.5 TRENDMAESTRO   riconosce un nuovo TREND sul nascere, non sbaglia mai. La sicurezza di identificare un nuovo TREND non ha prezzo. DESCRIZIONE TRENDMAESTRO identifica un nuovo TREND sul nascere, questo indicatore prende in esame la volatilita' i
Dark Support Resistance  is an Indicator for intraday trading. This Indicator is programmed to identify  Support and Resistance Lines , providing a high level of accuracy and reliability. Key benefits Easily visible lines Only the most important levels will be displayed Automated adjustment for each timeframe and instrument Easy to use even for beginners Never repaints, never backpaints, Not Lag 100% compatible with Expert Advisor development All types of alerts available: Pop-up, Email, Push
Quantum Entry   è un potente sistema di trading basato sull'azione del prezzo, costruito su una delle strategie più popolari e conosciute tra i trader: la strategia di   Breakout ! Questo indicatore genera segnali di acquisto e vendita chiari e cristallini basati sulla rottura di aree chiave di supporto e resistenza. A differenza dei tipici indicatori di breakout, utilizza calcoli avanzati per confermare con precisione la rottura! Quando si verifica una rottura, ricevi avvisi immediati. Nessun r
Altri dall’autore
Trend Lines v2 MT5
Quang Huy Quach
5 (1)
Trend Lines v2 MT5 is an intelligent auto trendline indicator that instantly detects key dynamic support and resistance zones. Built on pivot high/low structure, it delivers a clear and accurate view of market trends across all timeframes. Features Fully automatic trendline drawing based on precise pivot points. Filters out noise – only clean and reliable trendlines are shown. Control the number of lines to keep your chart neat and easy to read. Flexible customization: colors, line thickness, ra
FREE
Indicator Guide: Key Price Levels & Structure Shifts 1. Description The indicator is a technical analysis tool for the MetaTrader 5 platform. It is designed to automatically identify specific price movements and to highlight corresponding price zones based on preceding price action. This provides a visualization of key price areas according to the indicator's internal logic. 2. Visual Elements & Their Identification The indicator identifies and draws several types of visual elements on the chart
FREE
Breakout Finder MT5
Quang Huy Quach
5 (1)
The "Breakout Finder" is a technical indicator designed to automatically identify potential price breakouts and breakdowns on a chart. The highlight of this indicator is its robust signal filtering system, which helps traders avoid false signals (fakeouts) and focus on higher-probability trading opportunities. Key Features Automatic Pivot Point Detection: The indicator automatically identifies significant pivot highs and lows on the chart to establish potential support and resistance levels. Bre
FREE
The "Support Resistance Dynamic" indicator is a powerful technical analysis tool for the MetaTrader 5 platform, designed to automatically identify and plot dynamic Support and Resistance zones on price charts. This indicator helps traders easily recognize important price levels, potential reversal points, or breakout areas, thereby enabling more informed trading decisions. 2. Key Features Dynamic S/R Identification : Automatically identifies support and resistance zones based on an advanced Pivo
FREE
The Linear Regression Channel is a powerful technical analysis tool that helps visually identify the prevailing trend and potential price zones. Essentially, the indicator performs two main functions: It draws a trendline through the center of price action over a specified period. This line is calculated using the linear regression method, which results in the best possible "line of best fit" for the price data. From this center line, the indicator plots two parallel lines above and below, creat
FREE
1. Overview The Scalping PullBack Signal indicator is a powerful technical analysis tool designed to help traders identify scalping opportunities based on potential pullback and reversal signals. This tool is particularly useful on lower timeframes (below 15 minutes) but can also be applied on higher timeframes for longer-term trades. This indicator integrates several key analytical components, providing a comprehensive view of trends and potential entry/exit points, helping you make quick and e
FREE
The MultiFrameTrendAnalyzer is a versatile MetaTrader 5 (MT5) indicator designed to provide multi-timeframe trend analysis using Moving Average (MA) crossovers. This indicator synchronizes trend signals across multiple timeframes (M1, M5, M15, M30, H1, H4, D1, W1, MN1) and displays them with intuitive visual cues, including a colored trend line, signal arrows, and a customizable dashboard. Features Multi-Timeframe Analysis : Evaluates trends across up to nine timeframes, allowing traders to conf
FREE
The Supertrend indicator is a trend-following technical analysis tool designed to help traders identify the direction of market trends and potential entry/exit points. It operates based on price data and Average True Range (ATR) to create a dynamic signal line that changes color depending on the current trend. Green color: Indicates an uptrend. Red color: Indicates a downtrend. Supertrend is a useful indicator for both short-term and long-term trading, helping to filter out market noise and focu
FREE
The Pivot Point Supertrend indicator is a technical analysis tool designed for the MetaTrader 5 (MT5) platform. It combines two popular analytical methods: Pivot Points: Uses significant historical price highs and lows to identify potential support and resistance zones. These points are objective and stable. Supertrend: A well-known trend-following indicator that helps identify the current market trend and provides dynamic stop-loss levels. Indicator's Goal: By using the stability of Pivot Point
FREE
The MultiFrameRSIIndicator is a powerful MetaTrader 5 (MT5) indicator that leverages the Relative Strength Index (RSI) to analyze trends across multiple timeframes. This indicator synchronizes RSI-based trend signals from up to nine timeframes (M1, M5, M15, M30, H1, H4, D1, W1, MN1) and presents them with clear visual feedback, including a colored RSI line, signal arrows, and a customizable dashboard. Ideal for traders seeking momentum-based trend confirmation. Features Multi-Timeframe Analysis
FREE
The MTF (Multi-Timeframe) Candles indicator is a powerful tool that allows you to display candles from a higher timeframe (e.g., H1, H4, D1) directly on a lower timeframe chart (e.g., M5, M15, M30). The Problem It Solves: Instead of constantly switching back and forth between charts to analyze the main trend and detailed price action, this indicator merges both perspectives into one. You can instantly see the "big picture" while staying focused on trading signals on your current timeframe. Core
FREE
TMA Overlay
Quang Huy Quach
TMA Overlay Indicator for MT5 - User Guide 1. Introduction TMA Overlay is a versatile technical analysis indicator for the MetaTrader 5 platform. The indicator's goal is to provide traders with a comprehensive overview of the trend, potential entry signals, and key trading sessions, all integrated into a single chart. This is not a trading system, but a comprehensive analysis tool designed to help you make more informed decisions. 2. Core Indicator Components The indicator consists of multiple c
FREE
Welcome to Ultimate MA MTF , a multi-functional Moving Average (MA) indicator converted from the original TradingView version by ChrisMoody and upgraded with many powerful features. This is not just a typical MA line. It is a comprehensive technical analysis tool designed to provide traders with deep insights into trends, volatility, and potential trading signals, all within a single indicator. Key Features 8 Moving Average Types: Full support for the most popular MA types (SMA, EMA, WMA, HullMA
FREE
1. Introduction Smart Volume S/R Pro is a powerful technical analysis tool designed for the MetaTrader 5 platform. Unlike traditional Support & Resistance (S/R) indicators that rely on price peaks and troughs, this indicator automatically identifies critical S/R zones based on a core factor: Trading Volume . Core Principle: Price levels that witnessed exceptionally high trading volume in the past will often become significant psychological zones, where the price is likely to react strongly (eith
FREE
The "Volume Range Profile with Fair Value" (VRPFV) indicator is a powerful volume analysis tool designed to help traders better understand market structure and identify key price areas where significant institutional activity occurs. Instead of just looking at volume on individual candlesticks, VRPFV analyzes the distribution of volume by price level within a specific time range, providing deep insights into the "footprint" of smart money. VRPFV consists of the following core components: Upper &
FREE
Ichimoku V2
Quang Huy Quach
1. Overview The Ichimoku Kinko Hyo (or Ichimoku Cloud) is a comprehensive, all-in-one technical analysis indicator designed to provide a deep understanding of market trends, momentum, and dynamic support and resistance levels. This indicator provides a clean, standard implementation of the five core Ichimoku lines. Its key feature is a non-intrusive Status Dashboard that gives you an at-a-glance summary of the current market situation according to the Ichimoku system, allowing for quick and effi
FREE
The Vix_Fix indicator, or "Vix Fix," is a tool designed to identify potential market bottoms. It operates on the principle of measuring extreme fear or pessimism among the crowd, which are moments when the market often has a high probability of reversing to the upside. Main Purpose: To help traders find high-probability BUY (Long) entry points by identifying when the market is "oversold." How it Works In simple terms, the Vix Fix measures the distance between the current bar's Low and the Highes
FREE
The WaveTrend Oscillator indicator is an enhanced version of the classic WaveTrend Oscillator, a momentum indicator. It is designed to identify overbought/oversold conditions and provide potential trend reversal signals. The core difference in this version is the application of a data "normalization" algorithm. This ensures the indicator's oscillation lines remain balanced around the zero line, causing the indicator window to always stay naturally centered. This is especially useful when trading
FREE
1. Introduction The Market Squeeze Momentum Indicator (SQZMOM_LB) is a powerful technical analysis tool designed to help traders identify periods of low market volatility (the "squeeze" phase) and predict the direction and strength of price momentum after the squeeze ends. This indicator combines the principles of Bollinger Bands and Keltner Channels to detect changes in market volatility, along with a momentum oscillator to measure buying/selling pressure. 2. Key Components of the Indicator The
FREE
Fibonacci Bollinger Bands (FBB) Indicator - User Manual 1. Introduction Fibonacci Bollinger Bands (FBB) is a technical analysis indicator that combines three tools: Bollinger Bands , Fibonacci Ratios , and the Volume-Weighted Moving Average (VWMA) . The purpose of this indicator is to provide a multi-dimensional view of the market by helping to identify: Dynamic support and resistance zones. The general market trend. Volatility levels and potential accumulation phases (squeezes). Price breakouts
FREE
Ultimate EMA
Quang Huy Quach
Multi-Period EMA is a convenient indicator that displays multiple Exponential Moving Averages (EMAs) on a single chart. It is designed to help traders easily identify market trends and key crossover points without the need to add multiple individual EMA indicators. Key Features: Multiple EMAs in one: Simplifies chart analysis by combining several EMA lines into one indicator. Fully customizable: Easily change the period (default 20, 50, 100, 200), color, and thickness of each EMA line. Clean in
FREE
The Multi-Frame MACD Indicator is a robust MetaTrader 5 (MT5) indicator that utilizes the Moving Average Convergence Divergence (MACD) to analyze trends across multiple timeframes. This indicator synchronizes MACD-based trend signals from up to nine timeframes (M1, M5, M15, M30, H1, H4, D1, W1, MN1) and presents them with clear visual cues, including a colored MACD line, signal arrows, and a customizable dashboard. Perfect for traders seeking momentum and trend reversal insights. Features Multi-
FREE
1. Overview The ATR Dynamic Stop (CE) is a powerful technical indicator designed to help traders identify and follow market trends. Its core function is to provide a dynamic trailing stop-loss based on price volatility, as measured by the Average True Range (ATR) indicator. The main objectives of the ATR Dynamic Stop are: Profit Optimization: It helps you ride a strong trend by setting a reasonable stop-loss, preventing premature exits due to minor market noise and fluctuations. Risk Management:
FREE
Volume Flow Indicator (VFI) - User Manual 1. General Introduction The Volume Flow Indicator (VFI) is an advanced technical oscillator designed to measure the strength and sustainability of a price trend by incorporating both price and volume data. Developed based on the concepts of On-Balance Volume (OBV) but with significant improvements, the VFI provides deeper insight into money flow and the conviction behind price movements. This indicator is not an automated trading system but a powerful an
FREE
MultiFrame Volume Trend (MFVI) is a powerful VWAP-based indicator that displays volume trends across multiple timeframes in a clean, easy-to-read dashboard directly on your chart. Instantly capture the overall market direction in just seconds. Features Multi-timeframe VWAP analysis from M1 to MN1. Dashboard panel shows the trend state of each timeframe at a glance. Plots VWAP line and buy/sell arrows directly on the chart. Fully customizable: colors, line width, panel position, arrow symbols. Bu
FREE
MultiFrame MA
Quang Huy Quach
5 (1)
MultiFrame MA: A Multi-Timeframe Trend Indicator MultiFrame MA is a trend analysis indicator designed to provide a comprehensive market overview across various timeframes. Instead of relying on a single timeframe, this tool synthesizes information from multiple charts, giving users a holistic and reliable perspective. KEY FEATURES: Multi-Timeframe Analysis: The indicator analyzes data from various timeframes, from M1 up to Monthly, to help users identify trend confluence at different levels. MA
FREE
MultiFrame Pivot MT5
Quang Huy Quach
5 (1)
MultiFrame Pivot: A Multi-Timeframe Analysis Tool MultiFrame Pivot is an analysis indicator designed to provide an overview of the market based on Pivot Points across multiple timeframes. The indicator synthesizes information from different timeframes to give you a more comprehensive view of important price levels. KEY FEATURES: Multi-Timeframe Analysis: MultiFrame Pivot allows you to simultaneously monitor the price's status relative to Pivot Points (PP), Support 1 (S1), and Resistance 1 (R1)
FREE
The Smart Trend Tracker (OTT) is a technical analysis tool designed to help traders identify the direction and strength of a market trend. This indicator functions as an optimized moving average that adapts to market volatility, thereby providing dynamic support and resistance levels. The primary goal of the OTT is to smooth out price action and offer visual cues about potential changes in the trend. Core Components of the Indicator When you add the indicator to your chart, you will see two main
FREE
This indicator is a trading strategy designed to find high-probability entry points by combining two very popular indicators: Bollinger Bands (BB) and the Relative Strength Index (RSI) . The core idea is "dual confirmation" : a trade signal is only considered valid when both indicators agree. This helps filter out many of the false signals that occur when using just a single indicator, thereby increasing the reliability of each entry. Bollinger Bands are used to identify relative price value zon
FREE
The EMA Navigator Pro is an advanced version of the popular EMA indicator, designed to provide superior flexibility and multi-timeframe analysis capabilities. This indicator not only displays EMA lines but also offers a powerful alert system to ensure you never miss a crucial signal. Key Features: Multi-Timeframe Support: You can assign a separate timeframe to each individual EMA line, allowing you to analyze long-term (e.g., D1) and short-term (e.g., H1) trends on the same chart. Automatic Cro
FREE
Filtro:
Findolin
1970
Findolin 2025.09.29 09:25 
 

Ein sehr gut durchdachter Indikator, mit dem zu arbeiten richtig Freude macht. Vielen Dank!

Quang Huy Quach
17974
Risposta dello sviluppatore Quang Huy Quach 2025.09.29 13:25
Wow. I really appreciate your encouragement. Thanks
Rispondi alla recensione