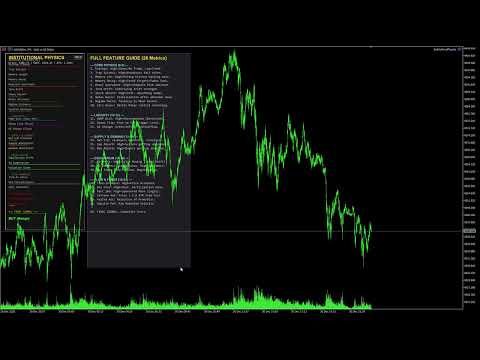
Institutional Physics Engine
- Indicatori
- Versione: 4.30
- Attivazioni: 5

Institutional Physics Engine (IPE) v4.20
Market Structure, Liquidity & Valuation Diagnostic System
🔷 WHAT THIS TOOL IS
Institutional Physics Engine (IPE) is a real-time market diagnostics indicator that analyzes price using behavioral physics, liquidity response, supply & demand pressure, and equilibrium valuation.
It does not predict price and does not generate blind buy/sell signals.
Instead, it answers three professional trading questions:
Where is fair value right now?
Who is in control (buyers, sellers, or market makers)?
Is price expensive (premium), cheap (discount), or fairly priced?
🔷 WHAT THIS TOOL IS NOT
❌ Not a signal bot
❌ Not a scalping indicator
❌ Not based on RSI / MACD / EMA
❌ Not Smart-Money “zones” or drawings
❌ Not a future-price predictor
This is a context engine, not an execution system.
🔷 HOW THE DASHBOARD IS ORGANIZED
The dashboard shows 26 live metrics, grouped into functional blocks.
Each bar represents strength, pressure, or risk, not direction alone.
🔵 1. CORE MARKET PHYSICS (0–9)
These describe how price behaves, not where it goes.
Metric Meaning How to Use
Entropy Market randomness High = No trade
Trap Success Failed breakouts High = Fade moves
Memory Length Structural memory High = Trend can persist
Memory Decay Trend fragility High = Trend weak
Reaction Overshoot Emotional spikes High = Snapback risk
Term Drift Directional force Shows bias, not entry
Shock Absorption Liquidity strength High = Safer environment
Behavioral Recovery Post-shock stabilization High = Smart money present
Regime Recovery Mean-reversion tendency High = Range conditions
Control Recovery Market-maker control High = Cleaner price
How to use
If Entropy is high → stand aside
If Shock + Control are high → structure is healthy
If Overshoot is high → avoid chasing price
🔵 2. LIQUIDITY & FLOW (10–12)
These show how stretched price is and whether participation supports the move.
Metric Meaning How to Use
VWAP Distance Overextension from value High = Reversion risk
Gamma Flip Proximity Volatility trigger zone High = Acceleration risk
OI Change (proxy) Capital inflow/outflow Confirms move quality
How to use
Large moves without OI/volume support are weak
Price far from VWEP = valuation risk
🔵 3. SUPPLY & DEMAND (13–15)
These measure auction imbalance, not zones.
Metric Meaning How to Use
Net S/D Pressure Who is winning Directional pressure
Supply Absorption Sellers absorbed Bullish context
Demand Absorption Buyers absorbed Bearish context
How to use
Rising price + seller absorption = strong trend
Falling price + buyer absorption = distribution
🔵 4. EQUILIBRIUM ENGINE (16–18)
This defines fair value and balance.
Metric Meaning How to Use
Equilibrium Drift Fair value movement High = regime shift
Equilibrium Compression Balance vs imbalance Low = range
Valuation Index Premium / Discount Core decision metric
Valuation Index interpretation
Positive → Premium (expensive)
Negative → Discount (cheap)
Near zero → Fair value
This is objective, ATR-normalized valuation.
🔵 5. FLOW & ACCEPTANCE (19–21)
These show whether price is accepted.
Metric Meaning How to Use
Time-In-Value Acceptance at fair value High = balance
Volume Concentration Institutional interest High = defended area
Participation Imbalance Sponsored move Filters fake moves
🔵 6. FLAGS & MOMENTUM (22–24)
Binary warnings and raw power.
Flag Meaning
Extreme Valuation Price far from fair value
Failed Auction Rejection of premium/discount
Impulse Power Raw velocity, not trend
🔵 7. FINAL SIGNAL (25)
This is a summary bias, not an entry signal.
BUY / SELL / NEUTRAL
Strength: Aggressive / Moderate / Range
Use it only as confirmation, never alone.
🔷 HOW TO USE THIS INDICATOR (PROPERLY)
✅ Correct Use
Market context
Trade filtering
Bias confirmation
Risk avoidance
Session diagnostics
Mean-reversion vs trend identification
❌ Incorrect Use
Blind entries
Scalping noise
Over-trading
Single-bar decisions
🔑 PRACTICAL WORKFLOWS
Trend Continuation Context
Low entropy
Strong term drift
Price near fair value
Supply or demand absorption aligned
Mean Reversion Context
Extreme valuation
High regime recovery
Failed auction flag
Weak participation
No-Trade Zone
High entropy
Equilibrium unstable
Conflicting S/D pressure
🔷 BEST MARKETS & TIMEFRAMES
✔ Indices
✔ Gold (XAUUSD)
✔ Forex majors
✔ Crypto (higher TFs)
Recommended TFs
M5–M15 for intraday context
M30–H1 for structure
H4 for regime bias
🔷 FINAL PHILOSOPHY
Institutional Physics Engine does not tell you what will happen.
It tells you what is happening — and whether it makes sense to participate.
This is how professional traders survive long-term.