Multi Timeframe Indicators in Seconds

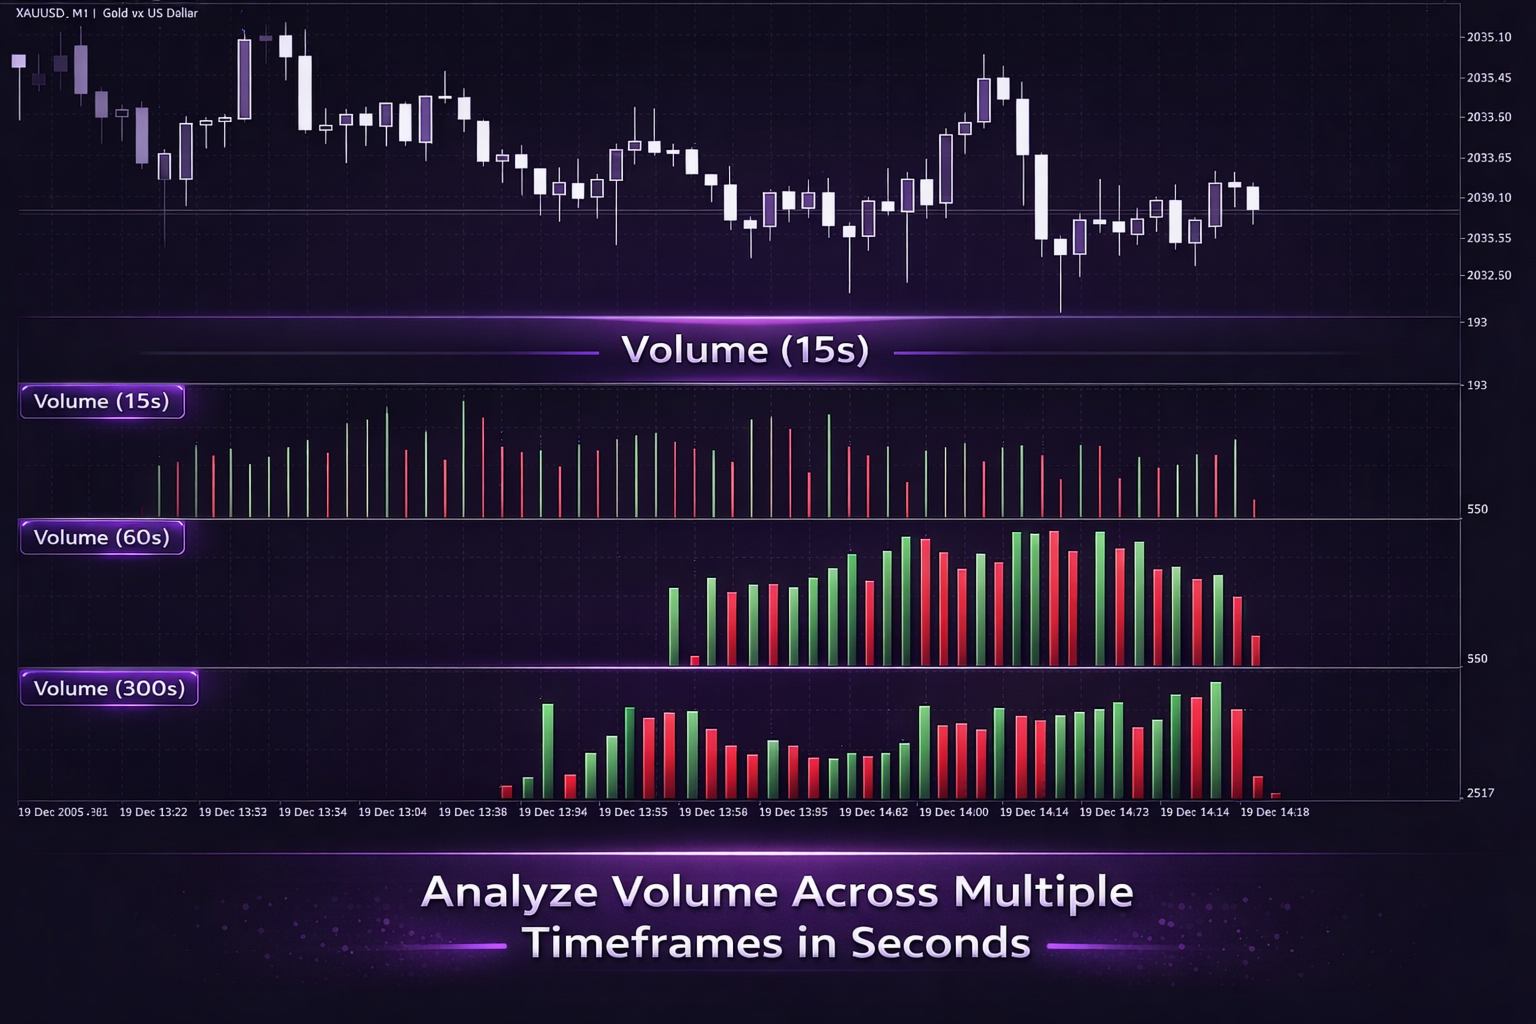
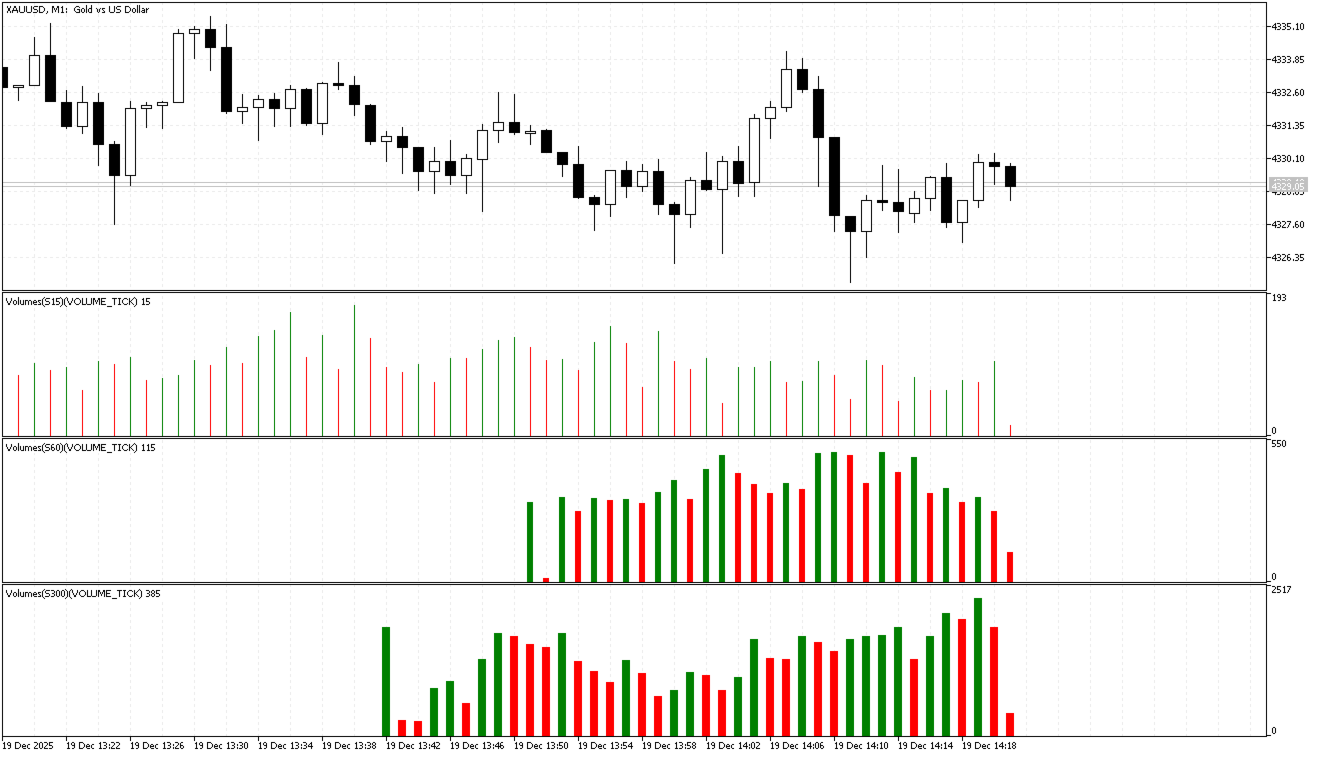
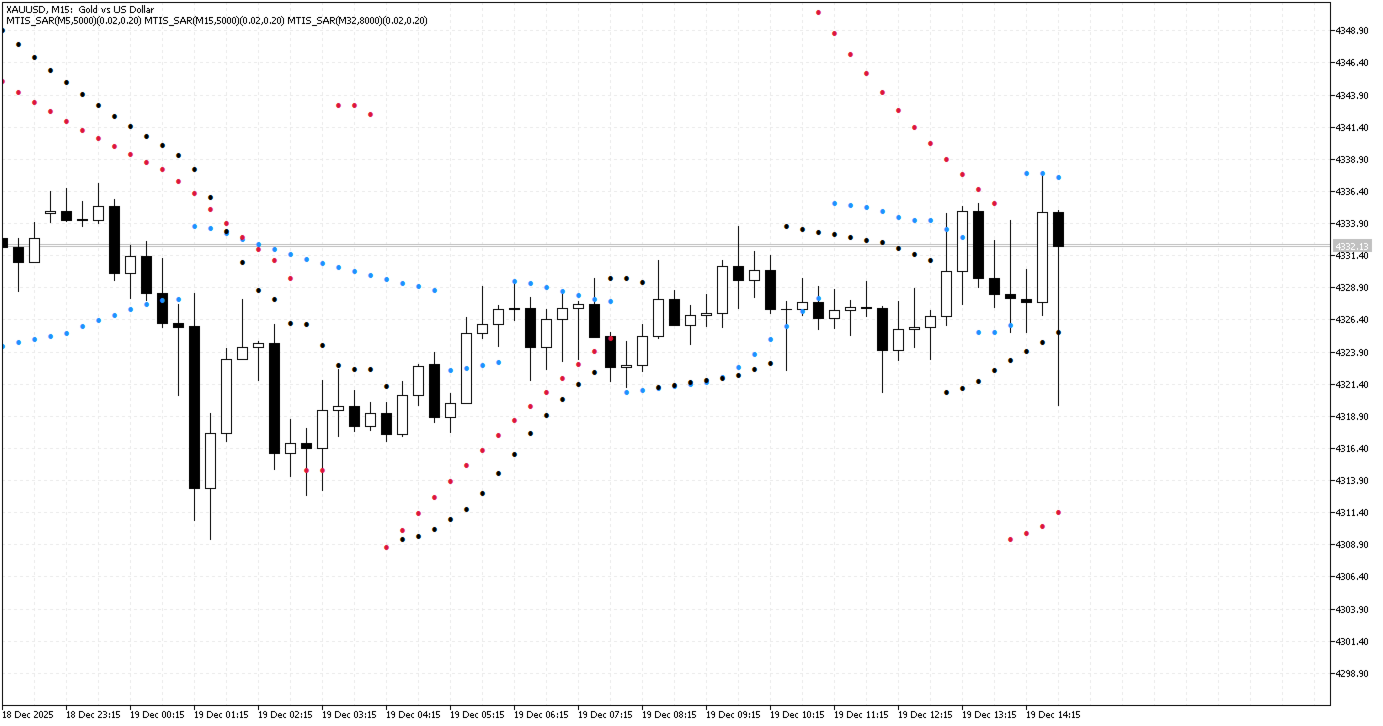
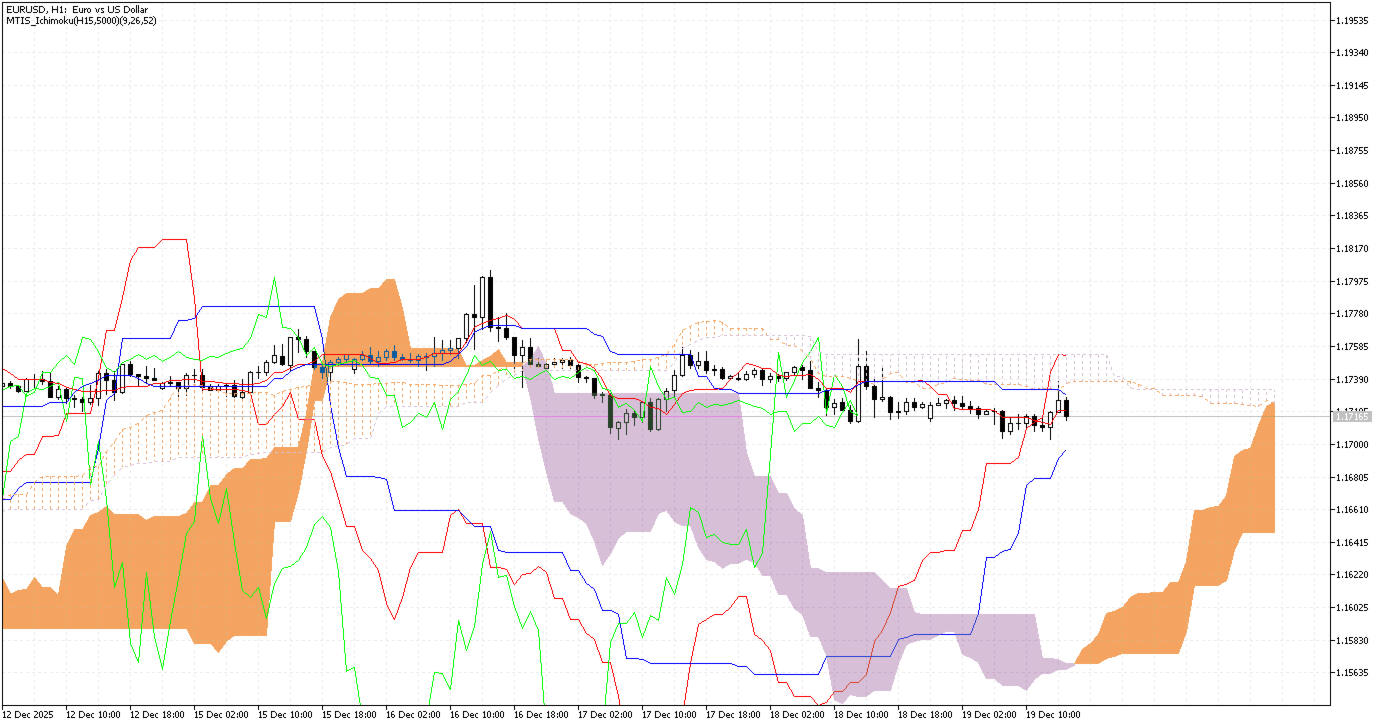
Multi Timeframe Indicators in Seconds is a bundle that includes most default custom indicators located in MQL5/Indicators/Examples/. These indicators are adapted to support multi-timeframe calculations, including seconds-based and custom timeframes. The product allows multiple indicators calculated on different timeframes to be displayed on a single chart.

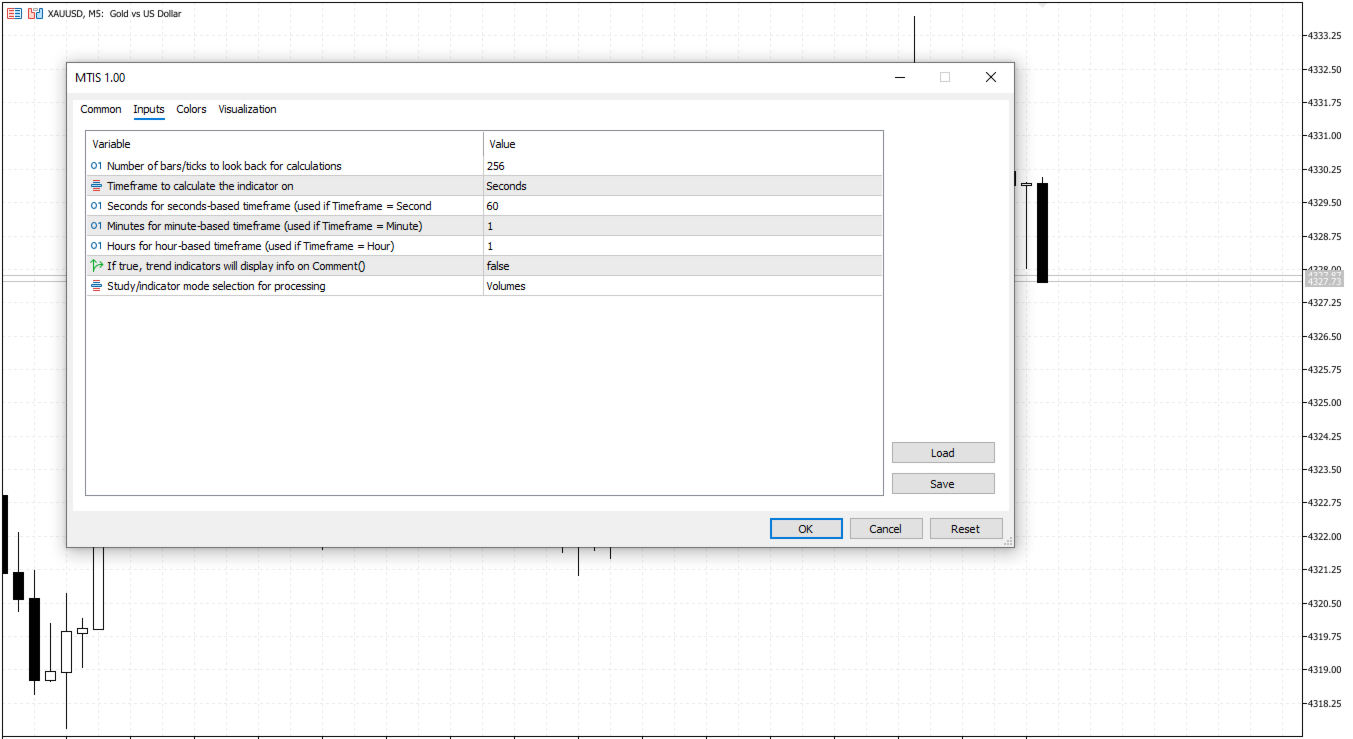
The loader indicator is used to select the desired indicator and calculation timeframe. Indicators can be applied to standard or non-standard timeframes, including seconds, minutes, and hours.


Intended Use

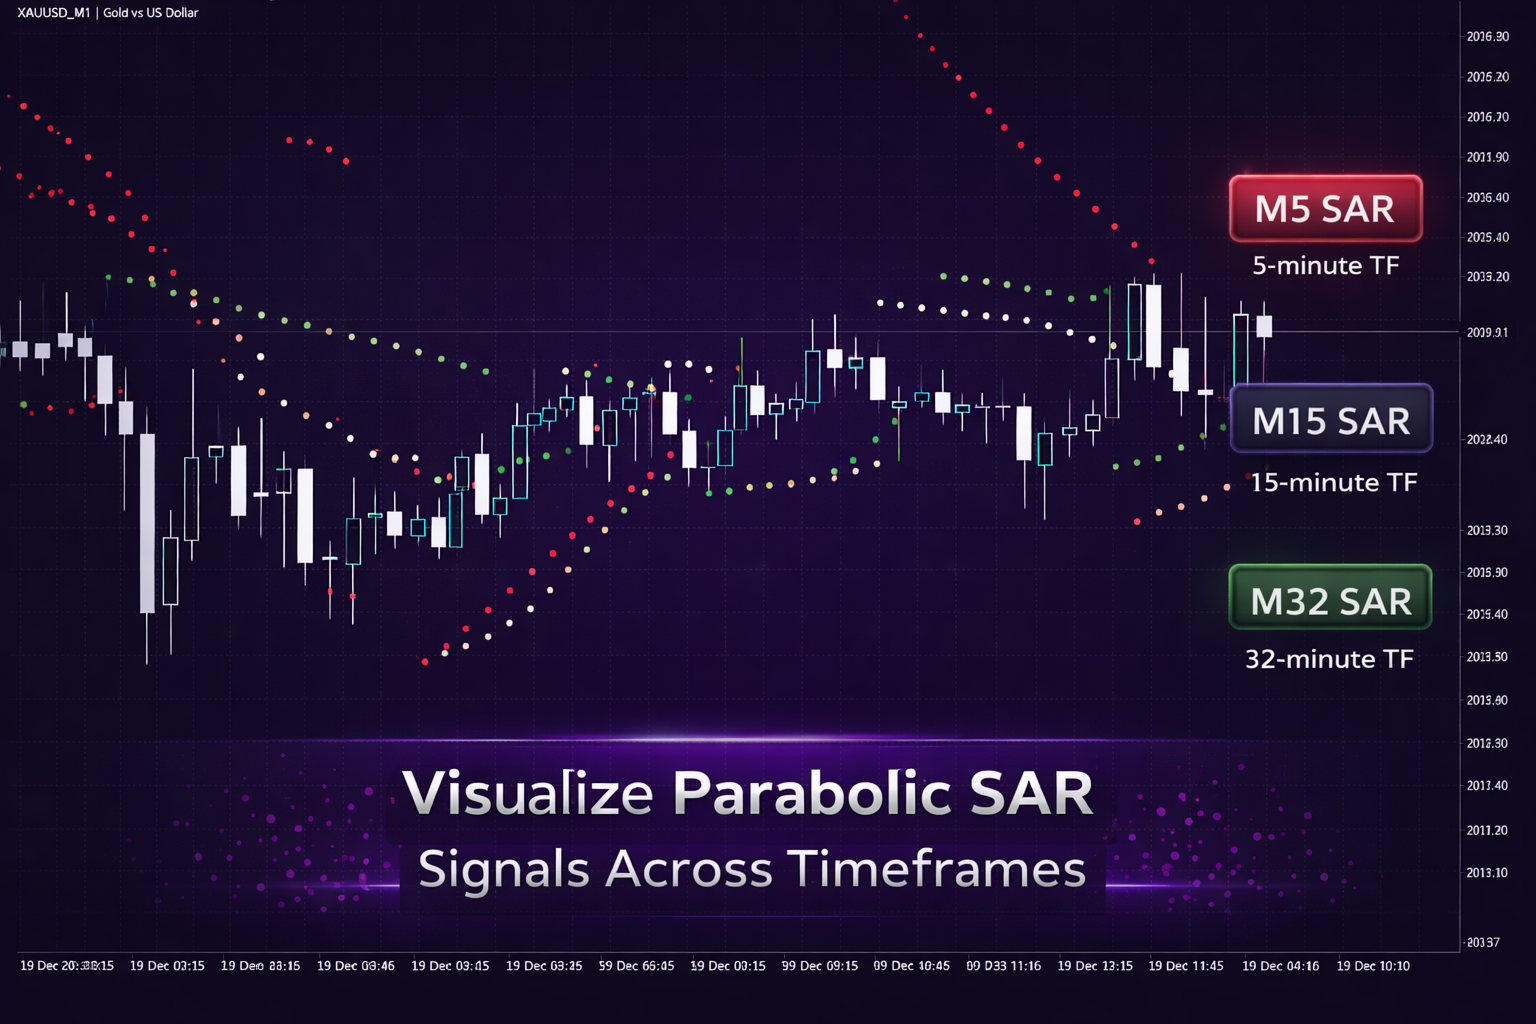
This indicator is intended for users who need to view indicator values calculated on different timeframes within one chart environment. It can be used to compare indicator behavior across higher or lower timeframes without opening multiple charts.


Functional Overview

  • Multi-Timeframe Display
    Indicators calculated on higher or lower timeframes can be shown on the current chart.

  • Seconds and Custom Timeframes
    Supports seconds-based, minute-based, and hour-based calculation intervals.

  • Single-Chart Layout
    Multiple indicators can be displayed together on one chart.

  • Indicator Selection
    One of the included default indicators can be selected and loaded through the input parameters.


Features

  • Calculation of indicators on any selected timeframe, including custom seconds, minutes, and hours

  • Configurable number of bars used for indicator calculations

  • Optional display of trend indicators information using the Comment function

  • Compatibility with most default MQL5 custom indicators

  • Ability to layer indicators on a chart without interfering with each other


Supported Indicators

  • Trend Indicators:

AMA, DEMA, FrAMA, Ichimoku, Parabolic SAR, TEMA, VIDYA, Custom Moving Average, ATR, ADX, ADXW, ASI, Price Channel

  • Oscillators:

RSI, Stochastic, CCI, DeMarker, RVI, Momentum, Ultimate Oscillator, TRIX, MI, ROC, VROC, Force Index, Williams %R, OBV, AD, PVT, W_AD, MFI, Market Facilitation Index, CHO, CHV

  • Volatility and Bands:

ATR, Bollinger Bands, StdDev, Price Channel

  • Pattern Indicators:

Fractals, ZigZag, ZigZag Color

  • Volume-Based Indicators:

Volumes, OBV, PVT, W_AD, CHO, CHV, Market Facilitation Index


Input Parameters

  • Number of bars to look back (default: 256)
    Defines how many bars are used in indicator calculations.

  • Timeframe (default: Minutes)
    Selects the calculation timeframe: Seconds, Minute, Hour, Day, Week, Month, or Current.

  • Seconds for seconds-based timeframe (default: 60)
    Used when the timeframe is set to Seconds.

  • Minutes for minute-based timeframe (default: 1)
    Used when the timeframe is set to Minute.

  • Hours for hour-based timeframe (default: 1)
    Used when the timeframe is set to Hour.

  • Display information via Comment() (default: false)
    Enables or disables on-chart text output.

  • Indicator selection (default: Volumes)
    Selects which indicator is loaded.

Usage Notes

  • The indicator is attached to the chart using the standard drag-and-drop method.

  • Input parameters can be adjusted after the indicator is loaded.

  • Visual properties such as colors and line styles can be modified using standard indicator settings after the indicator is loaded.

  • Some indicators require a warm-up period. For consistent results, check alignment with the standard indicators using standard timeframes.

Summary

Multi Timeframe Indicators in Seconds provides a way to display default MQL5 custom indicators calculated on different timeframes, including seconds-based intervals, within a single chart. The product supports configurable timeframes and parameters and is designed for users who require multi-timeframe indicator visualization in one workspace.


    Prodotti consigliati
    RSI Currency Strength Meter is a powerful and elegant multi-currency indicator that measures the real-time relative strength of the 8 major currencies using RSI logic. By calculating the smoothed performance of each currency across its major pairs and applying the RSI formula, it delivers clean and responsive strength lines that make it easy to spot which currencies are truly strong or weak at any moment. This indicator is particularly useful for visualizing currency correlations and divergence
    You can change the time period of the chart at the touch of a button. You can also change multiple charts at the touch of a button. You can also change multiple charts at the touch of a button,   saving you the trouble of changing time periods. We are live-streaming the actual operation of the system. Please check for yourself if it is usable. Please check it out for yourself. https://www.youtube.com/@ganesha_forex We do not guarantee your investment results. Investments should be made at you
    Volality Index Scalper
    Lesedi Oliver Seilane
    5 (1)
    Volality Index scalper indicator  Meant for Volality pairs such as Volality 10, 25, 50, 75 and 100 The indicator works on all timeframes from the 1 minute to the monthly timeframe the indicator is non repaint the indicator has 3 entry settings 1 color change on zero cross 2 color change on slope change 3 color change on signal line cross Orange line is your sell signal Blue line is your buy signal.
    Account Statistics – Dashboard per statistiche di trading in MetaTrader 5 Account Statistics è uno strumento di analisi e reporting per MetaTrader 5. Mostra le principali metriche del tuo conto di trading direttamente nel grafico e consente una valutazione strutturata delle tue performance su diversi periodi di tempo. Il prodotto è rivolto ai trader che desiderano analizzare sistematicamente i propri risultati e documentarli in modo trasparente. Funzioni Il dashboard integrato mostra in tempo
    Il nostro indicatore   Basic Support and Resistance   è la soluzione necessaria per aumentare l'analisi tecnica.Questo indicatore consente di proiettare i livelli di supporto e resistenza sul grafico/ MT4 gratuita Funzionalità Integrazione dei livelli di Fibonacci: Con la possibilità di visualizzare i livelli di Fibonacci insieme a livelli di supporto e resistenza, il nostro indicatore ti dà una visione ancora più profonda del comportamento del mercato e delle possibili aree di inversione. Ot
    Proxy OrderFlow MT5
    Vincent Jose Proenca
    Indicatore basato sul disequilibrio del tick-spread. TF: Funziona su tutti i timeframe (da M1 a D1). Coppie: Compatibile con Forex, indici, oro e CFD (regolazione automatica per JPY, Oro e CFD). Impostazioni: TickWindow (200) – finestra di osservazione dei tick SpreadWeight (1.5) – peso dello spread NormalizationPeriod (20) – periodo di normalizzazione (z-score) Overbought / Oversold (±3.0) – soglie di allerta AlertCooldown (300s) – tempo di raffreddamento tra gli avvisi Conclusione: Proxy Or
    Meridian Pro
    Ottaviano De Cicco
    5 (1)
    Meridian Pro 2.00: Professional Multi-Timeframe Trend Matrix for MT5 Meridian Pro 2.00 is a professional adaptive trend matrix for MetaTrader 5. It combines the original Meridian trend engine, a clean chart ribbon, closed-bar signal arrows, an 8-timeframe dashboard, Fuel momentum, weighted consensus, synthetic HTF processing and chart-native higher-timeframe context lines. The goal is simple: read current trend, multi-timeframe structure, strength, momentum and EA-ready state from one discipline
    Initial Balance or Sessions
    Cyril Louis Marc Maillet
    Initial Balance used by the Intitutionnal traders It open a square box on the chart when the hour of opening is reached. You can also configure it for full sessions. You can change colors easy. Parameters are set for a 1h delay by broker time, you can adjust by your setting if your broker dont match same hours For avoid too much memory usage you can also set a maximum of sessions in the past.
    EasyTrading Panel by Vexo
    Joseph Brian Ong Gustilo
    EasyTrading Panel V3.0 by Vexo — User Guide EasyTrading Panel V3.0 by Vexo — Manual Trade Entry Panel for MetaTrader 5 Works on ANY symbol • Auto Risk Sizing • Volume Profile POC BUY / SELL Market orders with SL → Confirm flow B.LIMIT / S.LIMIT Limit orders with OK / CANCEL buttons Auto POC Volume Profile Point of Control (live) MTF Trend EMA 50/200 on M5 M15 H1 H4 Panel Layout EA: ACTIVE Bal: $37.23 POC: 1.17951 Lot: 0.01 Risk%: 1.0 % RR: 1:2.5 SL: 1.16663 (auto) BUY SELL B.LIMIT S.LIMIT Live a
    Multi Pivot Indicator - Professional Trading Tool MULTI PIVOT PRO INDICATOR Professional Multi Pivot Indicator for MT4 5-in-1 Pivot Indicator Professional Trading Tool for MetaTrader 4 ENGLISH TÜRKÇE Multi Pivot Indicator PRO Classic Fibonacci Camarilla Woodie DM What is Multi Pivot Indicator? Multi Pivot Indicator is a professional trading tool that displays 5 different pivot calculation methods on your MetaTrader 4 charts. Pivot points are critical support and resistance
    Advanced Trading Chaos  The main purpose of the indicator is to help the trader detect the signals described by Bill Williams in his books to make a quick and correct trading decision. 1)Bullish/Bearish Reversal Bar(BDB) 2) Divergent Bar(DB) 3) Second Sage Signal — the third consecutive Awesome Oscillator bar  4) Working fractals (Fractals that worked above/below the red forehead  5) Three bar coloring modes 5.1) Coloring of bars according to the AO indicator (Including the squatting bar) 5.2
    Laguerre SuperTrend Clouds   adds an Adaptive Laguerre averaging algorithm and alerts to the widely popular SuperTrend indicator. As the name suggests,   Laguerre SuperTrend Clouds (LSC)   is a trending indicator which works best in trendy (not choppy) markets. The SuperTrend is an extremely popular indicator for intraday and daily trading, and can be used on any timeframe. Incorporating Laguerre's equation to this can facilitate more robust trend detection and smoother filters. The LSC uses the
    Universal Soul Reaper
    Pieter Gerhardus Van Zyl
    Universal Soul Reaper is an atmospheric market-flow oscillator designed to interpret price behavior as a cycle of spiritual energy. Instead of reacting to raw price alone, it visualizes the state of the market’s soul —revealing when momentum is awakening, stabilizing, or fading. The indicator operates in a separate window and presents three interwoven entities: the Ectoplasmic Veil , the Spirit Boundary , and the Soul Core . Together, they form a living framework that helps traders sense pressu
    The Gann Box (or Gann Square) is a market analysis method based on the "Mathematical formula for market predictions" article by W.D. Gann. This indicator can plot three models of Squares: 90, 52(104), 144. There are six variants of grids and two variants of arcs. You can plot multiple squares on one chart simultaneously Parameters Square — selection of a Gann square model: 90 — square of 90 (or square of nine); 52 (104) — square of 52 (or 104); 144 — universal square of 144; 144 (full) — "full
    Pipfinite creates unique, high quality and affordable trading tools. Our tools may or may not work for you, so we strongly suggest to try the Demo Version for MT4 first. Please test the indicator prior to purchasing to determine if it works for you. We want your good reviews, so hurry up and test it for free...we hope you will find it useful. Combo Energy Beam with Swing Control Strategy: Confirm swing pullback signals Watch Video: (Click Here) Energy Beam with Trend Laser Strategy: Confirm Tre
    Volume Profile V6
    Andrey Kolesnik
    4.67 (3)
    Indicatore del profilo di volume del mercato + oscillatore intelligente. Funziona su quasi tutti gli strumenti: coppie di valute, azioni, futures, criptovalute, sia su volumi reali che su tick. È possibile impostare la definizione automatica dell'intervallo di costruzione del profilo (ad esempio, per una settimana o un mese, ecc.), oppure impostare l'intervallo manualmente spostando i confini (due linee verticali: rossa e blu). Viene visualizzato sotto forma di istogramma. La larghezza dell'isto
    Noize Absorption Index - is the manual trading system that measures the difference of pressure between bears forces and bulls forces. Green line - is a noize free index that showing curent situation. Zero value of index shows totally choppy/flat market.Values above zero level shows how powerfull bullish wave is and values below zero measures bearish forces.Up arrow appears on bearish market when it's ready to reverse, dn arrow appears on weak bullish market, as a result of reverse expectation.
    Level Volume Pro
    John Samfel Bucton Josol
    HAT IT DOES   MONTHLY HIGH & LOW — AUTO-DRAWN EVERY MONTH Draws the High and Low of every month for the current year (or any year you set). Each level extends as a horizontal ray into the future so you always see where price is reacting to historical monthly extremes. Color-coded (blue = high, red = low), labeled (JAN HIGH, FEB LOW etc.), fully customizable width and style. Toggle individual months on or off.   WEEKLY HIGH & LOW
    The Multi Pairs Forex Indicator is an   advanced trading too l that allows traders to track and analyze the performance of   multiple currency pairs in real-time   on a single chart. It consolidates data from various Forex pairs, providing an at-a-glance overview of market conditions across different currencies and helps you save time. Useful for various trading styles, including scalping, day trading, and swing trading. Whether you're monitoring major pairs like EUR/USD, GBP/USD, or more exoti
    TrendFusion Pro — strumento di analisi dei trend TrendFusion Pro ti aiuta a organizzare il lavoro sui grafici e semplifica la ricerca dei punti di ingresso. Elimina il rumore del mercato e mostra solo segnali chiari basati sul suo sistema di analisi integrato. Funzionalità: Segnali visivi con frecce per individuare potenziali punti di ingresso. Notifiche e avvisi integrati. Analisi multi-timeframe per filtrare i segnali deboli. Valutazione della forza del trend per decisioni più consapev
    THE DAILY DECIDER BUYSELL PRO INDICATOR OVERVIEW Unlock the Market's Daily Secret: The Daily Decider BuySell Indicator is Here! Tired of analysis paralysis? Struggling with false signals and noisy markets? What if you could know the market's primary intention within the first few hours of the day and trade with unwavering confidence? Introducing the Daily Decider BuySell Indicator for MetaTrader 5. Pro Tip: Never Miss the first signal of the day This isn't just another indicator cluttering yo
    Arrow Micro Scalper è un indicatore progettato per lo scalping e il trading a breve termine, integrato in qualsiasi grafico e strumento finanziario (valute, criptovalute, azioni, metalli). Nel suo lavoro utilizza l'analisi delle onde e un filtro sulla direzione del trend. Consigliato per l'uso su Time Frame da M1 a H4. Come lavorare con l'indicatore. L'indicatore contiene 2 parametri esterni per modificare le impostazioni, il resto è già configurato per impostazione predefinita. Le frecce gran
    "Impulses and Corrections 5" is created to help traders navigate the market situation. The indicator shows multi-time frame upward and downward "Impulses" of price movements. These impulses are the basis for determining the "Base" , which is composed of zones of corrections of price movements, as well as "Potential" zones for possible scenarios of price movement. Up and down impulses are determined based on a modified formula of Bill Williams' "Fractals" indicator. The last impulse is always "U
    Scalper Pivot
    Yosi Malatta Madsu
    Scalper Pivot detects respectable small reversal areas that can be used to mark repeatable opportunity windows. For M1 timeframe. Setup/inputs: First, set one pip on price, e.g. EURUSD to 0.0001, USDJPY to 0.01, or XAUUSD to 0.1. Or select AUTO for autodetect common symbols. Set minimum and maximum range on pips, if you want scalp between 10 to 20 pips then set it to 10 and 20 respectively. Set detection window to any candle count you want. Set it too low or too high would be less accurate.
    Spike Hunter Boom Crash
    Dawid Aaron Zinserling
    Spike Hunter has been developed for Crash and boom markets. Spike Hunter does not  repaint. Also please download SPIKE HUNTER(B)-boom and SPIKE HUNTER(B)-crash from the comments section to assist with extra confirmation Buy Signal ; Make sure that the trend for boom is Uptrend on 15 and 30min. Use the SPIKE HUNTER(B)-boom on your chart. Once the Up arrow comes on and the SPIKE HUNTER(B)-boom line color is blue then its the best time to trade. Sell Signal ; Make sure that the trend for crash i
    US30NinjaMT5
    Satyaseelan Shankarananda Moodley
    US30 Ninja is a 5 minute scalping indicator that will let know you when there is a trade set up (buy or sell). Once the indicator gives the trade direction, you can open a trade and use a 30 pip stop loss and a 30 pip to 50 pip take profit. Please trade at own own risk. This indicator has been created solely for the US30 market and may not yield positive results on any other pair. 
    Boom and crash arrow
    Tshivhidzo Moss Mbedzi
    This indicator is based on an advanced strategy primarily for trading spikes on Boom and Crash Indices. Complex algorithms were implanted to detect high probability entries only. It alerts on potential Buy and Sell entries. To trade spikes on the Deriv or Binary broker, only take Buy Boom and Sell Cash alerts. It was optimized for 5-minute timeframe. the indicator will  tell you were to sell and buy its good for  boom and crash and currency  pairs  ,EURUSD ,GBPUSD,NAS100, 89% no repaint  Feature
    ICT Silver Bullet Indicator is designed to make trading the Silver Bullet strategy easier and more efficient. It combines all key parts of the ICT Silver Bullet method and highlights them on the chart, so you can focus on placing trades. Each feature is highly customizable, allowing you to adjust settings and visuals to match your trading style and preferences. The control panel lets you quickly hide or show specific tools for clearer analysis. The indicator also includes an alert system that n
    **   All Symbols   x   All Timeframes   scan just by pressing scanner button ** Discount: The price is $50$, But now it is just $39, Limited time offer is active. *** Contact me  to send you instruction and add you in "Trend Reversal group" for sharing or seeing experiences with other users. Introduction: Trendlines are the most famous technical analysis in trading . Trendlines continually form on the charts of markets across all the different timeframes providing huge opportunities for traders
    Support Resistance Pro Toolkit Donchian is a support and resistance indicator for MetaTrader 5 designed to highlight important market zones using a Donchian-based swing detection model. It draws clean support and resistance levels or zones directly on the chart, tracks broken structures, identifies sweep events, and provides a live dashboard with useful statistics. Pricing Launch Price : $33 Incremental Price Increase : The price will increase by $10 after every 10 purchases. Final Price : $69 T
    Gli utenti di questo prodotto hanno anche acquistato
    SuperScalp Pro
    Van Minh Nguyen
    4.59 (22)
    SuperScalp Pro – Sistema avanzato di indicatore scalping multi-filtro SuperScalp Pro è un indicatore di scalping avanzato che combina il classico Supertrend con molteplici filtri intelligenti di conferma per aiutare a identificare opportunità di trading. Funziona in modo efficiente su diversi timeframe da M1 a H4, con prestazioni ottimizzate su XAUUSD, BTCUSD e principali coppie Forex. L’indicatore fornisce chiari segnali Buy e Sell, insieme a livelli di ingresso, stop loss e take profit calcola
    Entry In The Zone and SMC Multi Timeframe is a real-time 2-in-1 market analysis tool that combines market structure analysis and a No Repaint BUY / SELL signal system into a single indicator, built on Smart Money Concepts (SMC) — a widely adopted framework used by professional traders to understand market structure. This indicator helps you see the market more clearly, make decisions based on structure rather than guesswork, and focus on high-probability zones where price is more likely to react
    Divergence Bomber
    Ihor Otkydach
    4.9 (87)
    Ogni acquirente dell’indicatore riceverà inoltre gratuitamente: L’utilità esclusiva “Bomber Utility”, che gestisce automaticamente ogni operazione, imposta i livelli di Stop Loss e Take Profit e chiude le posizioni secondo le regole della strategia I file di configurazione (set file) per adattare l’indicatore a diversi asset I set file per configurare il Bomber Utility in tre modalità: “Rischio Minimo”, “Rischio Bilanciato” e “Strategia di Attesa” Una guida video passo-passo per installare, conf
    Power Candles MT5
    Daniel Stein
    5 (8)
    Power Candles V3 - Indicatore di forza ad ottimizzazione automatica Power Candles V3 trasforma la forza delle valute e degli strumenti in un piano di trading attuabile su ogni grafico a cui è collegato. Invece di limitarsi a colorare le candele, esegue un'auto-ottimizzazione in tempo reale in background e ti fornisce i migliori valori di Stop Loss, Take Profit e soglia di segnale per il simbolo che hai davanti. Basta un clic per adottarlo nel trading live: i raggi di ingresso, Stop Loss e Take P
    Grabber System MT5
    Ihor Otkydach
    4.83 (23)
    Ti presento un eccellente indicatore tecnico: Grabber, che funziona come una strategia di trading "tutto incluso", pronta all’uso. In un solo codice sono integrati strumenti potenti per l’analisi tecnica del mercato, segnali di trading (frecce), funzioni di allerta e notifiche push. Ogni acquirente di questo indicatore riceve anche gratuitamente: L’utility Grabber: per la gestione automatica degli ordini aperti Video tutorial passo dopo passo: per imparare a installare, configurare e utilizzare
    SignalTech MT5 is a trading system for EURUSD, USDCHF, USDJPY, AUDUSD, NZDUSD, EURJPY, AUDJPY, NZDJPY, CADJPY H2 and H3 Timeframe.  It can generate signals with Buy/Sell Arrows and Pop-Up/Sound Alerts. Each signal has clear Entry and Stop Loss levels, which should be automatically flagged on the chart, as well as potential Targets 1, 2, and 3. The Entry and TP levels are fixed after the trade is taken. The exit level is dynamic. If there are signs of a potential short-term trend reversal, the
    Se acquisti questo indicatore, riceverai il mio Trade Manager Professionale + EA  GRATUITAMENTE. Innanzitutto è importante sottolineare che questo sistema di trading è un indicatore Non-Repainting, Non-Redrawing e Non-Lagging, il che lo rende ideale sia per il trading manuale che per quello automatico. Corso online, manuale e download di preset. Il "Sistema di Trading Smart Trend MT5" è una soluzione completa pensata sia per i trader principianti che per quelli esperti. Combina oltre 10 indicat
    Gann Made Easy è un sistema di trading Forex professionale e facile da usare che si basa sui migliori principi del trading utilizzando la teoria di mr. WD Gann. L'indicatore fornisce segnali ACQUISTA e VENDI accurati, inclusi i livelli di Stop Loss e Take Profit. Puoi fare trading anche in movimento utilizzando le notifiche PUSH. CONTATTAMI DOPO L'ACQUISTO PER RICEVERE GRATUITAMENTE LE ISTRUZIONI DI TRADING E OTTIMI INDICATORI EXTRA! Probabilmente hai già sentito parlare molte volte dei metodi d
    Btmm state engine pro
    Garry James Goodchild
    5 (4)
    BTMM State Engine Pro is a MetaTrader 5 indicator for traders who use the Beat The Market Maker approach: Asian session context, kill zone timing, level progression, peak formation detection, and a multi-pair scanner from a single chart. It combines cycle state logic with a built-in scanner dashboard so you do not need the same tool on many charts at once. What it does Draws the Asian session range; session times can follow broker server offset or be set in inputs. Tracks level progression (L
    FX Trend MT5 NG
    Daniel Stein
    5 (4)
    FX Trend NG: La Nuova Generazione di Intelligenza di Trend Multi-Mercato Panoramica FX Trend NG è uno strumento professionale di analisi del trend multi-timeframe e monitoraggio dei mercati. Ti consente di comprendere la struttura completa del mercato in pochi secondi. Invece di passare tra numerosi grafici, puoi identificare immediatamente quali strumenti sono in trend, dove il momentum sta diminuendo e dove esiste un forte allineamento tra i timeframe. Offerta di Lancio – Ottieni FX Trend NG
    Presentazione       Quantum Breakout PRO   , l'innovativo indicatore MQL5 che sta trasformando il modo in cui scambi le zone di breakout! Sviluppato da un team di trader esperti con un'esperienza di trading di oltre 13 anni,       Quantum Breakout PRO       è progettato per spingere il tuo viaggio di trading a nuovi livelli con la sua strategia innovativa e dinamica della zona di breakout. Quantum Breakout Indicator ti fornirà frecce di segnalazione sulle zone di breakout con 5 zone target di
    Quantum TrendPulse
    Bogdan Ion Puscasu
    5 (23)
    Ecco   Quantum TrendPulse   , lo strumento di trading definitivo che combina la potenza di   SuperTrend   ,   RSI   e   Stocastico   in un unico indicatore completo per massimizzare il tuo potenziale di trading. Progettato per i trader che cercano precisione ed efficienza, questo indicatore ti aiuta a identificare con sicurezza le tendenze di mercato, i cambiamenti di momentum e i punti di entrata e uscita ottimali. Caratteristiche principali: Integrazione SuperTrend:   segui facilmente l'andame
    Top indicator for MT5   providing accurate signals to enter a trade without repainting! It can be applied to any financial assets:   forex, cryptocurrencies, metals, stocks, indices .  Watch  the video  (6:22) with an example of processing only one signal that paid off the indicator! MT4 version is here It will provide pretty accurate trading signals and tell you when it's best to open a trade and close it. Most traders improve their trading results during the first trading week with the help of
    Atomic Analyst MT5
    Issam Kassas
    3.94 (31)
    Innanzitutto, vale la pena sottolineare che questo indicatore di trading non è repaint, non è ridisegno e non presenta ritardi, il che lo rende ideale sia per il trading manuale che per quello automatico. Manuale utente: impostazioni, input e strategia. L'Analista Atomico è un indicatore di azione del prezzo PA che utilizza la forza e il momentum del prezzo per trovare un miglior vantaggio sul mercato. Dotato di filtri avanzati che aiutano a rimuovere rumori e segnali falsi, e aumentare il pote
    Trend Screener Pro MT5
    STE S.S.COMPANY
    4.85 (104)
    Indicatore di tendenza, soluzione unica rivoluzionaria per il trading di tendenze e il filtraggio con tutte le importanti funzionalità di tendenza integrate in un unico strumento! È un indicatore multi-timeframe e multi-valuta al 100% non ridipingibile che può essere utilizzato su tutti i simboli/strumenti: forex, materie prime, criptovalute, indici e azioni. Trend Screener è un indicatore di tendenza che segue un indicatore efficiente che fornisce segnali di tendenza a freccia con punti nel gra
    OmniSync Projection
    Antonio-alin Teculescu
    5 (1)
    Chronos Fractal Engine is an innovative price projection indicator for MetaTrader 5, designed to transform your technical analysis by intelligently identifying and projecting historical price patterns. Built upon an advanced correlation algorithm and the fractal principles of the market, this powerful tool visualizes potential future price movements, giving you a unique edge in your trading decisions. What is Chronos Fractal Engine? At its core, the Chronos Fractal Engine employs a sophisticat
    Questo cruscotto mostra gli ultimi   pattern armonici   disponibili per i simboli selezionati, in modo da risparmiare tempo ed essere più efficienti /   versione MT4 . Indicatore gratuito:   Basic Harmonic Pattern Colonne dell'indicatore Symbol :   vengono visualizzati i simboli selezionati Trend:   rialzista o ribassista Pattern:   tipo di pattern (gartley, butterfly, bat, crab, shark, cypher o ABCD) Entry:   prezzo di ingresso SL:   prezzo di stop loss TP1:   1 prezzo di take profit TP2:
    Azimuth Pro
    Ottaviano De Cicco
    5 (7)
    Azimuth Pro V2: Synthetic Fractal Structure and Confirmed Entries for MT5 Overview Azimuth Pro is a multi-level swing structure indicator by Merkava Labs . Four nested swing layers, swing-anchored VWAP, ABC pattern detection, three-timeframe structural filtering, and closed-bar confirmed entries — one chart, one workflow from micro-swings to macro-cycles. This is not a blind signal product. It is a structure-first workflow for traders who care about location, context, and timing. V2 Launch Offe
    FX Levels MT5
    Daniel Stein
    5 (13)
    FX Levels: Supporti e Resistenze di Precisione Eccezionale per Tutti i Mercati Panoramica Rapida Cercate un modo affidabile per individuare livelli di supporto e resistenza in ogni mercato—coppie di valute, indici, azioni o materie prime? FX Levels fonde il metodo tradizionale “Lighthouse” con un approccio dinamico all’avanguardia, offrendo una precisione quasi universale. Basato sulla nostra esperienza reale con i broker e su aggiornamenti automatici giornalieri più quelli in tempo reale, FX
    Innanzitutto, vale la pena sottolineare che questo Strumento di Trading è un Indicatore Non-Ridipingente, Non-Ridisegnante e Non-Laggante, il che lo rende ideale per il trading professionale. Corso online, manuale utente e demo. L'Indicatore Smart Price Action Concepts è uno strumento molto potente sia per i nuovi che per i trader esperti. Racchiude più di 20 utili indicatori in uno solo, combinando idee di trading avanzate come l'Analisi del Trader del Circolo Interno e le Strategie di Tradin
    RelicusRoad Pro: Sistema Operativo Quantitativo di Mercato 70% DI SCONTO ACCESSO A VITA (TEMPO LIMITATO) - UNISCITI A 2.000+ TRADER Perché la maggior parte dei trader fallisce anche con indicatori "perfetti"? Perché operano su Singoli Concetti isolati. Un segnale senza contesto è una scommessa. Per vincere serve CONFLUENZA . RelicusRoad Pro non è un semplice indicatore. È un Ecosistema Quantitativo completo . Mappa la "Fair Value Road", distinguendo tra rumore e rotture strutturali. Smetti di in
    Trend indicator AI mt5
    Ramil Minniakhmetov
    5 (17)
    Trend Ai indicator è un ottimo strumento che migliorerà l'analisi di mercato di un trader combinando l'identificazione della tendenza con punti di ingresso utilizzabili e avvisi di inversione. Questo indicatore consente agli utenti di navigare nelle complessità del mercato forex con fiducia e precisione Oltre ai segnali primari, l'indicatore Ai di tendenza identifica i punti di ingresso secondari che si presentano durante i pullback o i ritracciamenti, consentendo ai trader di capitalizzare le
    Cominciamo con la verità. Nessun indicatore da solo ti renderà profittevole. Se qualcuno ti dice il contrario, ti sta vendendo un sogno. Qualsiasi indicatore che mostra frecce perfette di acquisto/vendita può essere reso impeccabile — basta ingrandire la giusta sezione della storia e catturare solo i trade vincenti. Noi non lo facciamo.  SMC Intraday Formula è uno strumento. Legge la struttura del mercato per te, identifica le zone a più alta probabilità e ti mostra esattamente come appare la t
    Crystal Heikin Ashi Signals
    Muhammad Jawad Shabir
    5 (2)
    Crystal Heikin Ashi Signals - Professional Trend & Signal Detection Indicator Advanced Heikin Ashi Visualization with Intelligent Signal System for Manual & Automated Trading Final Price: $149 ---------> Price goes up $10 after every 10 sales . Limited slots available — act fast . Overview Crystal Heikin Ashi Signals is a professional-grade MetaTrader 5 indicator that combines pure Heikin Ashi candle visualization with an advanced momentum-shift detection system. Designed for both manual traders
    ARICoins
    Temirlan Kdyrkhan
    ARICoin is a powerful trading companion designed to generate high-probability entry signals with dynamic TP/SL/DP levels based on volatility. Built-in performance tracking shows win/loss stats, PP1/PP2 hits, and success rates all updated live. Key Features: Buy/Sell signals with adaptive volatility bands Real-time TP/SL/DP levels based on ATR Built-in MA Filter with optional ATR/StdDev volatility Performance stats panel (Success, Profit/Loss, PP1/PP2) Alerts via popup, sound, push, or email Cust
    Market Structure Order Block Dashboard MT5 è un indicatore MT5 progettato per i trader che vogliono leggere la struttura di mercato e le principali zone di reazione del prezzo direttamente sul grafico. Combina BOS, ChoCH, Order Blocks, Fair Value Gaps (FVG), Liquidità, Kill Zones, Volume Profile e un pannello compatto per un'analisi rapida. Questo indicatore è rivolto ai trader che utilizzano la struttura di mercato, i concetti ICT e Smart Money come quadro decisionale. Può aiutare a individuare
    Smart Stop Indicator – Precisione intelligente dello stop-loss direttamente sul grafico Panoramica Smart Stop Indicator è la soluzione ideale per i trader che desiderano posizionare il loro stop-loss in modo chiaro e metodico, senza dover indovinare o affidarsi all’intuizione. Questo strumento combina la logica classica del price action (massimi e minimi strutturali) con un moderno riconoscimento dei breakout per identificare il prossimo livello di stop realmente logico. In trend, in range o i
    Bill Williams Advanced
    Siarhei Vashchylka
    5 (11)
    Bill Williams Advanced is designed for automatic chart analysis using Bill Williams' "Profitunity" system. The indicator analyzes four timeframes at once. Manual (Be sure to read before purchasing) Advantages 1. Analyzes the chart using Bill Williams' "Profitunity" system. Signals are displayed in a table in the corner of the screen and on the price chart. 2. Finds all known AO and AC signals, as well as zone signals. Equipped with a trend filter based on the Alligator. 3. Finds "Divergence Bar
    FX Power MT5 NG
    Daniel Stein
    5 (31)
    FX Power: Analizza la Forza delle Valute per Decisioni di Trading Più Intelligenti Panoramica FX Power è lo strumento essenziale per comprendere la reale forza delle principali valute e dell'oro in qualsiasi condizione di mercato. Identificando le valute forti da comprare e quelle deboli da vendere, FX Power semplifica le decisioni di trading e rivela opportunità ad alta probabilità. Che tu segua le tendenze o anticipi inversioni utilizzando valori estremi di Delta, questo strumento si adatta
    IX Power MT5
    Daniel Stein
    4.92 (13)
    IX Power: Scopri approfondimenti di mercato per indici, materie prime, criptovalute e forex Panoramica IX Power è uno strumento versatile progettato per analizzare la forza di indici, materie prime, criptovalute e simboli forex. Mentre FX Power offre la massima precisione per le coppie di valute utilizzando i dati di tutte le coppie disponibili, IX Power si concentra esclusivamente sui dati di mercato del simbolo sottostante. Questo rende IX Power una scelta eccellente per mercati non correlat
    Altri dall’autore
    ZigZag Support and Resistance Levels
    Tshidiso Ephraim Mpakanyane
    2 (1)
    Livelli di Supporto e Resistenza ZigZag  è un indicatore per MetaTrader 5 che identifica i livelli di supporto e resistenza basandosi sui punti pivot ZigZag. Raggruppa anche i livelli vicini in zone usando un metodo di clustering per aiutare a visualizzare le aree in cui il prezzo ha reagito più volte. Funzionalità principali 1. Rilevamento Pivot ZigZag Individua massimi e minimi dei movimenti usando i parametri configurabili Depth, Deviation e Backstep . 2. Rilevamento livelli di supporto e re
    FREE
    Multi Timeframe Chart in Seconds is an indicator that allows traders to visualize price data calculated from custom timeframes directly on a single chart. The indicator supports seconds-based, minute-based, and hour-based calculations and displays the resulting price action as color candles on the active chart. Additional Resources If you want to add indicators to a non-standard chart , consider the related product: Multi Timeframe Indicators in Seconds https://www.mql5.com/en/market/product/15
    FREE
    ZigZag SNR Levels  is an indicator that identifies support and resistance levels based on ZigZag pivot points. It also groups nearby levels into zones using a clustering method to help visualize areas where price has reacted multiple times. Key Features 1. ZigZag Pivot Detection Detects swing highs and lows using configurable Depth, Deviation, and Backstep parameters. Processes historical price data to maintain a consistent pivot structure. 2. Support & Resistance Level Detection Creates suppor
    FREE
    Trade History on Chart
    Tshidiso Ephraim Mpakanyane
    Trade History on Chart is a simple utility indicator that displays the profit, duration, volume and other trade properties of closed trade from history. Features: Filter history to show only gains or loss of the trade. Show holding time of the trade. Accumulate the profits based on daily, weekly etc. Switch to display only boxes of text. Change text colors. Fast and user friendly.
    FREE
    Filtro:
    Nessuna recensione
    Rispondi alla recensione