Multi Timeframe Chart in Seconds
- Indicatori
- Versione: 2.0
- Aggiornato: 27 dicembre 2025

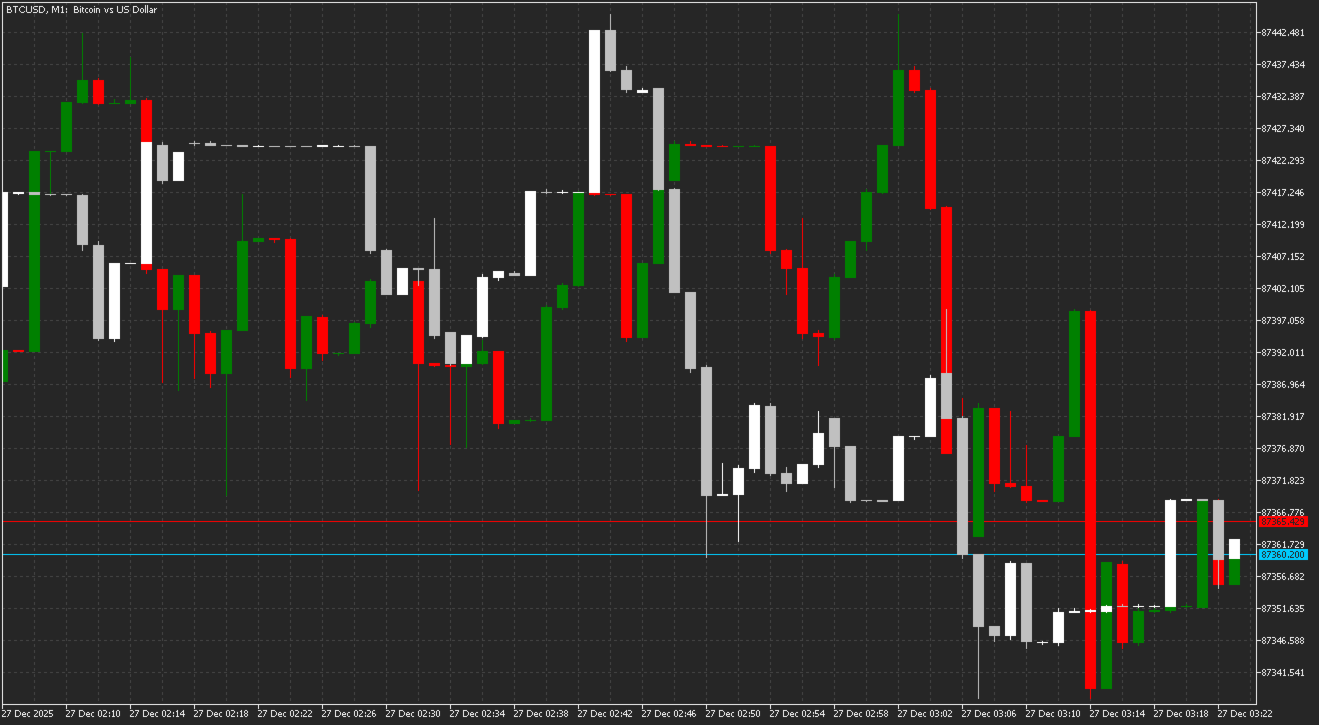
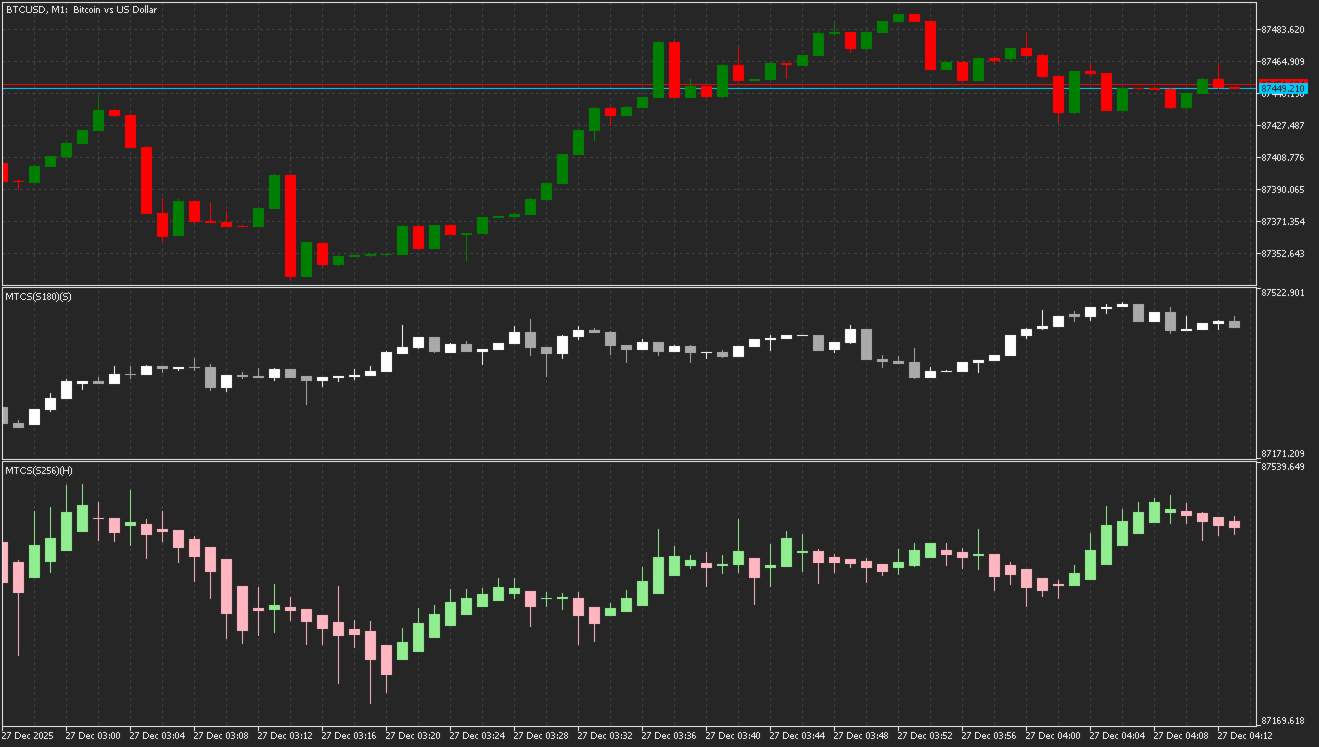
Multi Timeframe Chart in Seconds is an indicator that allows traders to visualize price data calculated from custom timeframes directly on a single chart. The indicator supports seconds-based, minute-based, and hour-based calculations and displays the resulting price action as color candles on the active chart.
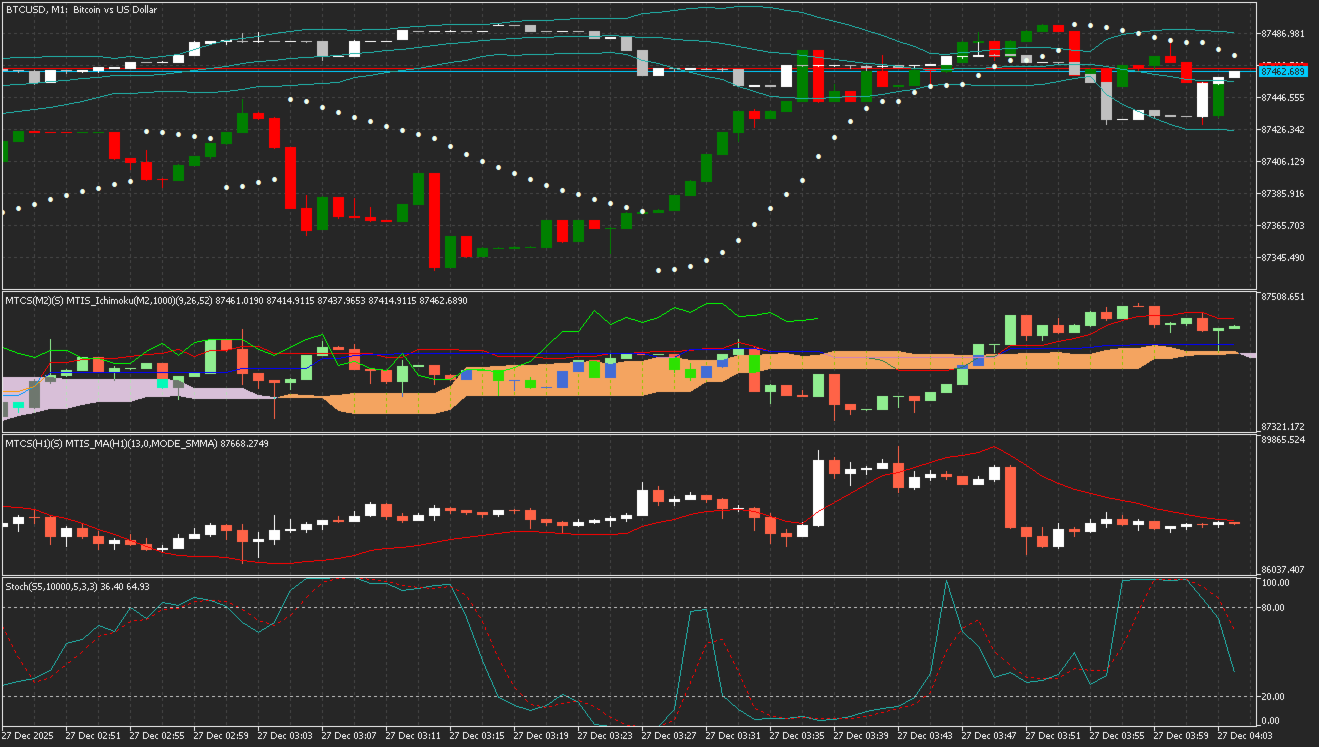
| Additional Resources If you want to add indicators to a non-standard chart, consider the related product: Multi Timeframe Indicators in Seconds This product is a bundle of most default custom indicators located in MQL5/Indicators/Examples/, adapted to support multi-timeframe calculations, including seconds-based and custom timeframes. The included loader indicator allows you to select the desired indicator and calculation timeframe. Indicators can be applied to standard or non-standard timeframes, including seconds, minutes, and hours. |
Who This Indicator Is For
This indicator is intended for users who need to observe price behavior from different timeframes within a single chart. It is suitable for traders who analyze market structure across seconds, minutes, or hours and require a compact multi-timeframe view without switching chart periods.
How It Works
Multi-Timeframe Display
Price data calculated on higher, lower, or custom timeframes can be displayed on the current chart using color candles.
Seconds and Custom Timeframes
Supports seconds-based aggregation as well as minute- and hour-based calculation intervals.
Single-Chart Layout
Custom timeframe price action is rendered directly on the active chart, allowing comparison with the current timeframe.
Chart Type Selection
Supports both Standard and Heiken Ashi candle rendering modes.
Key Features
• Aggregation and display of price data from custom seconds, minutes, or hours timeframes
• Unified timeframe management with automatic validation
• Configurable lookback range for calculation stability
• Support for Standard and Heiken Ashi candle types
• Optional display in a separate indicator window
• Clean candle rendering without interfering with existing indicators
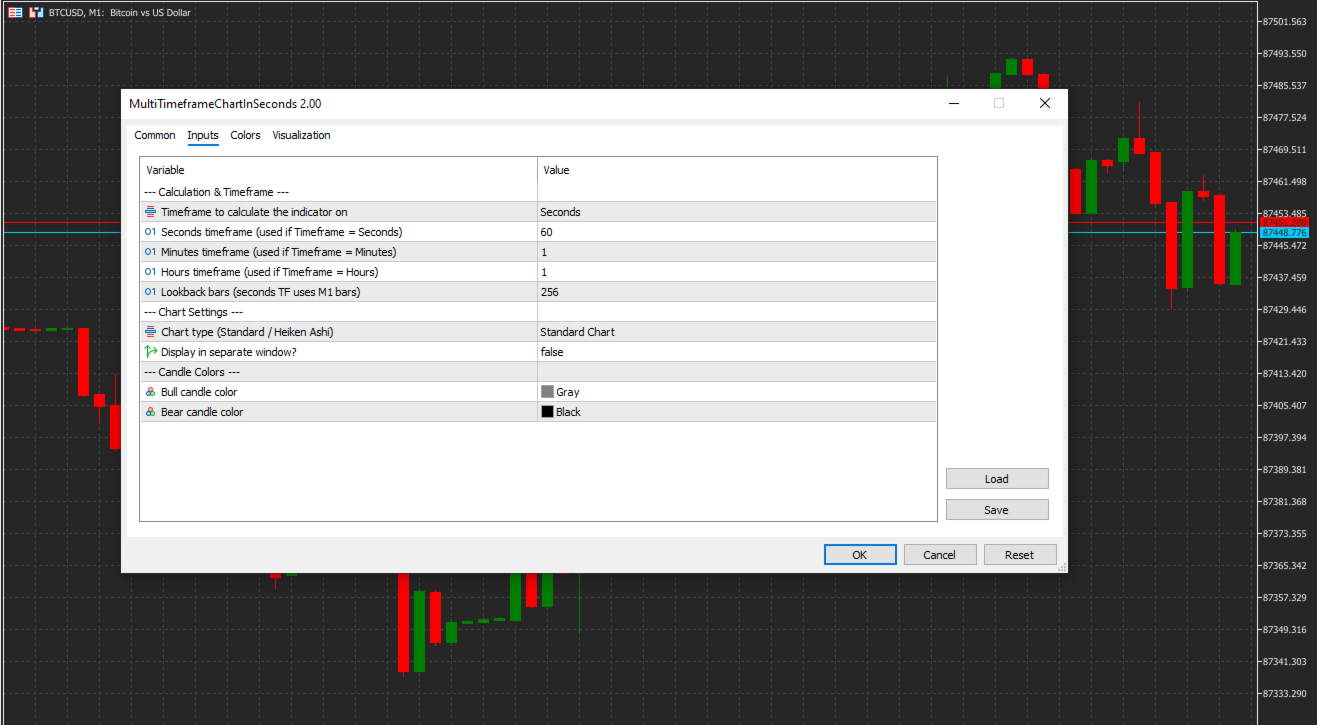
Input Parameters
| Parameter | Default | Description |
|---|---|---|
| Lookback Bars | 256 | Defines how many base timeframe bars are used to build the custom timeframe data. Valid range: 256–1024. |
| Timeframe | Seconds | Selects the calculation timeframe mode: • Seconds • Minutes • Hours |
| Seconds | 60 | Used when the timeframe mode is set to Seconds. |
| Minutes | 1 | Used when the timeframe mode is set to Minutes. |
| Hours | 1 | Used when the timeframe mode is set to Hours. |
| Chart Type | Standard | Selects between Standard candles and Heiken Ashi candles. |
| Separate Window | false | Displays the indicator in a separate subwindow when enabled. |
| Candle Colors | — | Allows customization of bullish and bearish candle colors. |
Summary
Multi Timeframe Chart in Seconds provides a way to visualize price action calculated from custom seconds, minutes, or hours timeframes within a single chart. The indicator is designed for traders who require accurate multi-timeframe candle representation without switching chart periods, offering a clean and efficient workflow for advanced timeframe analysis.
L'utente non ha lasciato alcun commento sulla valutazione.