Professional Trading Analytics
- Utilità
-
Pavel Malyshko
 Voglio essere onesto e dire parole molto importanti: non fare trading sugli ultimi soldi è molto stressante e questa è una delle regole più importanti relative agli investimenti.
Lascia che tu non compri nulla da me, ma saprò che non stai dando gli ultimi soldi. - Versione: 21.0
- Aggiornato: 1 dicembre 2025
- Attivazioni: 15
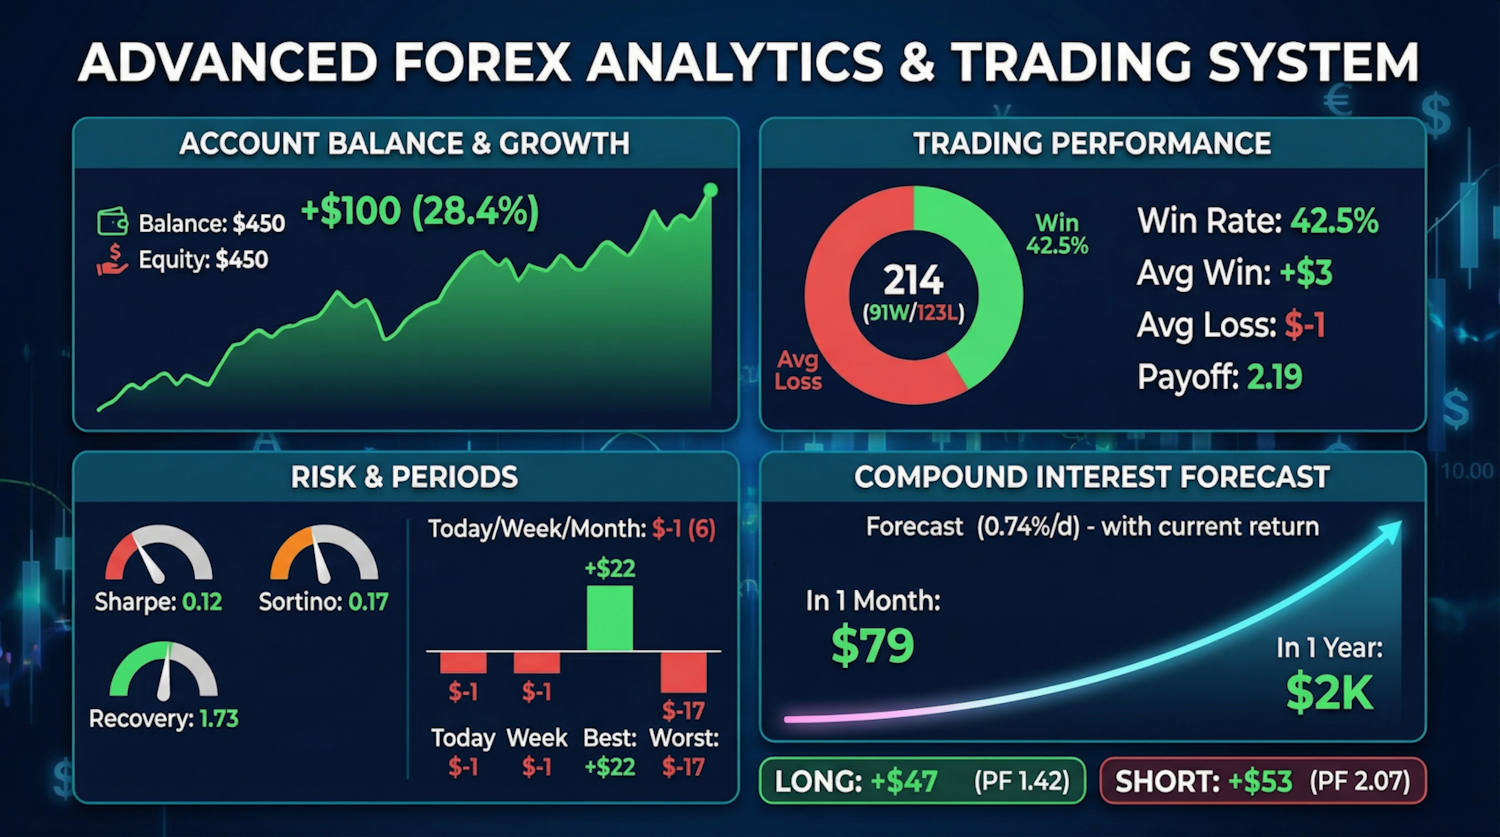
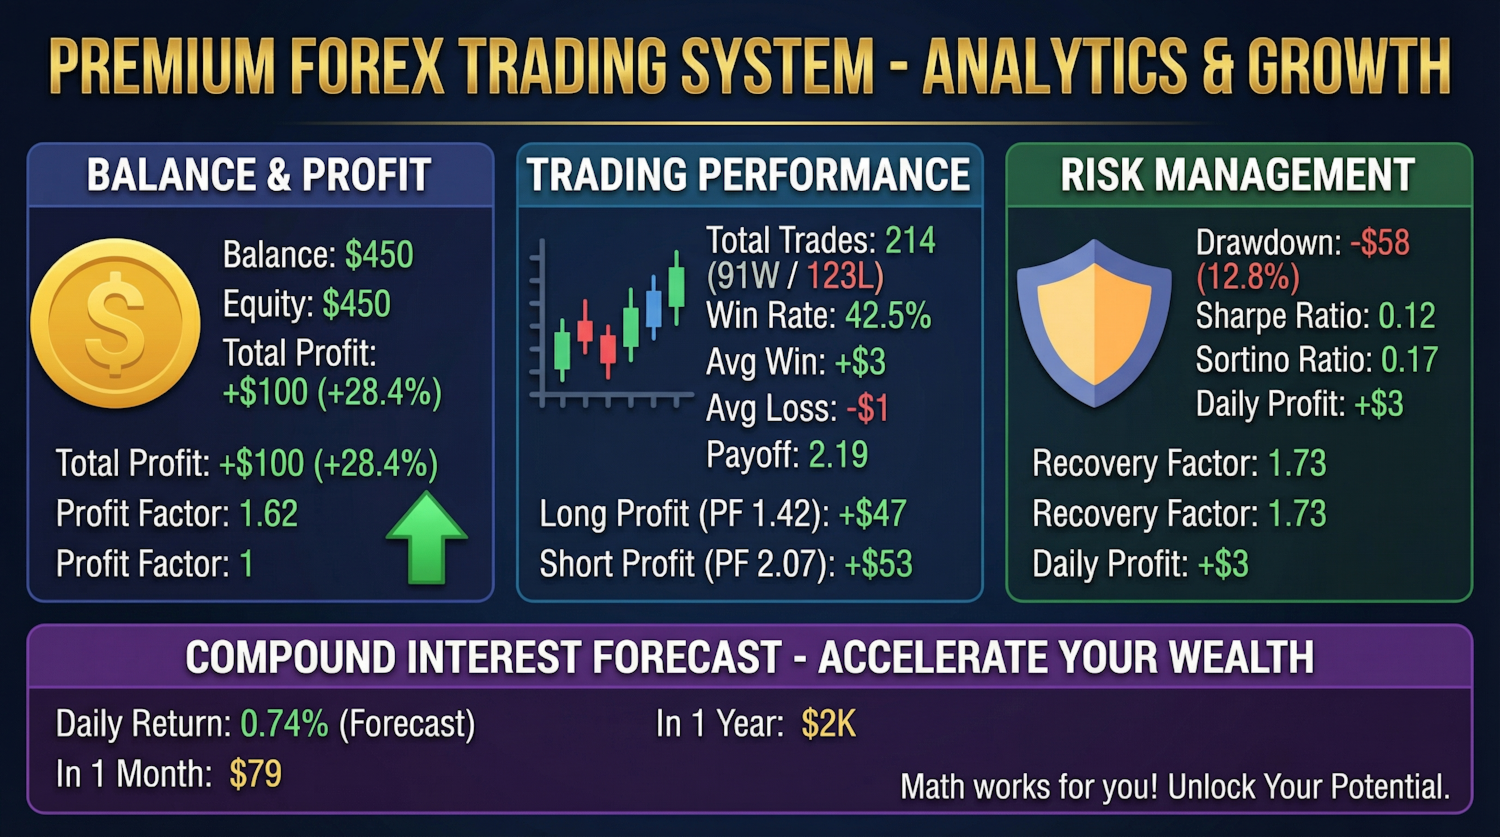
Professional Trading Analytics — A Complete Picture of Your Trading in Real Time
Do you know your true statistics?
Most traders trade blindly. They don't know their true win rate, don't understand which direction is profitable, and which is wasting their deposit. They don't see that their long trades are losing money while their short trades are profitable.
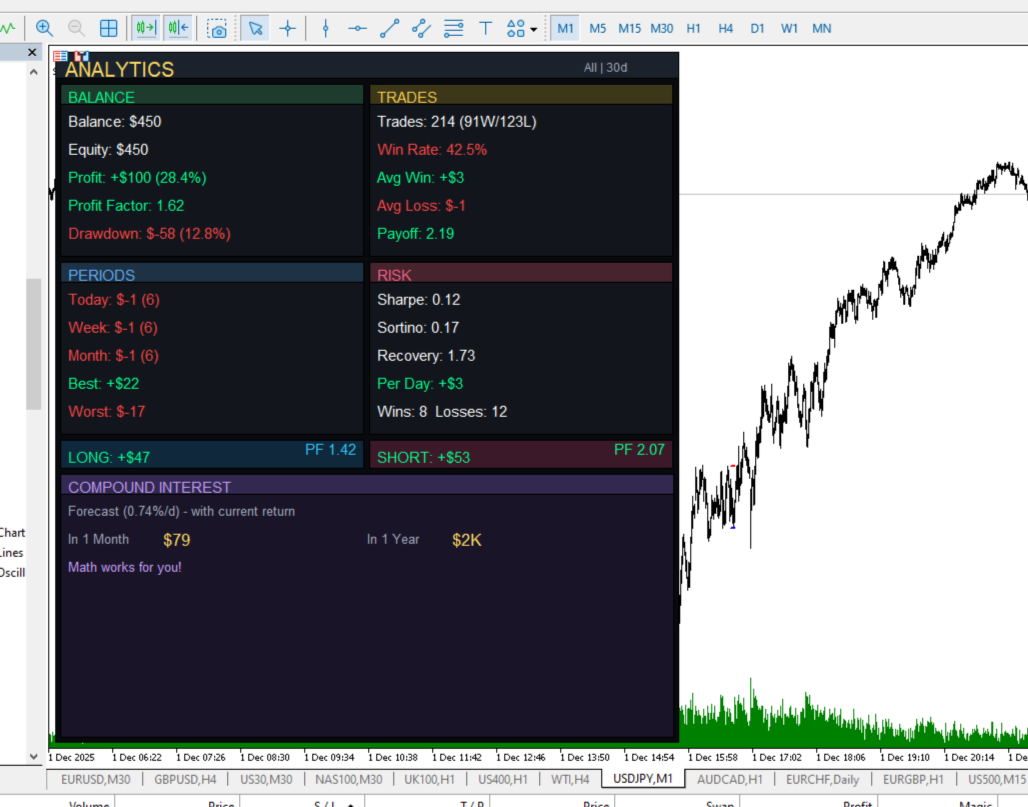
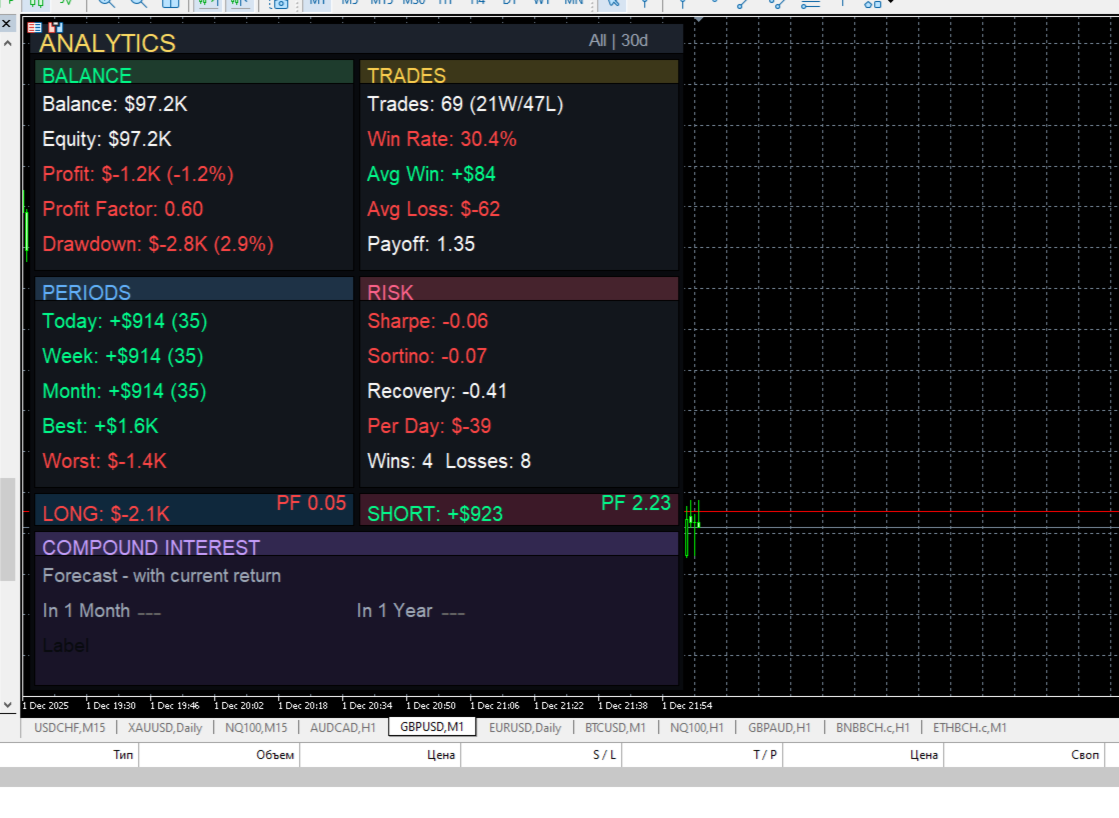
Professional Trading Analytics shows the truth about your trading — right on the chart, in real time.
What will you get?
Instant analysis of all trades:
- Balance and Equity — the current account status
- Net Profit — how much you've actually earned
- Profit Factor — the main indicator of system performance
- Maximum Drawdown — in dollars and as a percentage of balance
Deep trade statistics:
- Win Rate — the percentage of profitable trades
- Average Profit and Loss — an understanding of mathematical expectation
- Payoff Ratio — the ratio of average win to average loss
- Best and Worst Trade — the extremes of your trading
Analysis by Period:
- Today — the current day's result
- Week — weekly dynamics
- Month — monthly result
- Number of trades for each period
Professional Risk Ratios:
- Sharpe Ratio — return taking into account volatility
- Sortino Ratio — return taking into account only negative volatility
- Recovery Factor — the system's ability to recover from drawdowns
- Win and Loss Streaks — control Emotional swings
Directional analysis is a key feature:
- Separate Long and Short statistics
- Profit factor for each direction
- Find out which direction makes money and which takes it away
Compound interest forecast:
- Visualize potential growth based on current returns
- Monthly and annual forecasts
- Motivate you to see the power of consistent trading
Flexible filtering
Analyze what you need:
- All symbols — a comprehensive picture of the entire account
- Current symbol — statistics only for the open chart
- Custom symbol — select any instrument for analysis
Customizable period:
- Analysis for any number of days
- From short-term to long-term statistics
Full customization
- Font size — 8 to 16 points
- Panel width — 30% to 70% of the screen
- Position — left or right
- Language — English or Russian
Why is this important?
"You can't improve what you don't measure."
Traders don't lose money because the market is difficult. They lose because they don't know their weaknesses:
- Are you trading long in a downtrend? The dashboard will show you a loss on long positions.
- Are you overtrading? You'll see the number of trades per day.
- Are you experiencing large drawdowns? The Recovery Factor will show you if the system is coping.
- Is your win rate high, but you're running out of money? The Payoff Ratio will explain why.
Technical Features
- Works on any timeframe.
- Doesn't affect terminal performance.
- Automatically updates every 2 seconds.
- Adaptive design to fit the window size.
- Includes swaps and commissions in calculations.
Who is this utility for?
- For traders who want to understand their statistics
- For those who keep a diary and need accurate data
- For managers who need to monitor multiple strategies
- For anyone who takes trading seriously as a business
Investing in Self-Understanding
You spend hours analyzing charts. Take a second to see the truth about your trading.
Professional Trading Analytics is more than just an indicator. It's a mirror of your trading.
Place it on a chart. Look at the numbers. Make decisions based on facts, not feelings.
Description of settings:
Language
Select the language of the panel interface. Two options are available: English and Russian. All text on the panel will be displayed in the selected language.
Analysis Period Days
The number of days for which trading statistics will be collected and analyzed. For example, a value of 30 will show results for the last month, a value of 7 will show results for the last week, and a value of 365 will show results for the year.
Symbol Filter
Determines which trading instruments to collect statistics for:
- All Symbols — analysis of all trades on the account for all instruments
- Current Symbol — analysis only for the instrument on the chart of which the panel is installed
- Custom Symbol — analysis for a specific instrument, the name of which is specified in the next setting
Custom Symbol
The name of the trading instrument to analyze if Custom Symbol is selected in the previous setting. For example: EURUSD, GBPUSD, XAUUSD. The name must exactly match the instrument name in the terminal.
Panel Position
Panel position on the chart:
- Right — the panel is displayed on the right side of the chart
- Left — the panel is displayed on the left side of the chart
Font Size
The size of the text on the panel in points. Acceptable values are from 8 to 16. Smaller values allow for more information to be displayed, while larger values improve readability on larger monitors.
Panel Width percent
The width of the panel relative to the width of the chart window. Acceptable values are from 30 to 70. A value of 50 means the panel will occupy half the width of the chart.