MT5 Candles
- Indicatori
-
Arinze Michael Ejike
 Trasformiamo strategie di trading in indicatori personalizzati e soluzioni algoritmiche per ForexTester6, cTrader, MetaTrader 4 e MetaTrader 5.
 - Versione: 1.0
- Attivazioni: 17
Candles is a comprehensive chart visualization indicator for MetaTrader 5 that transforms how traders view price action. Instead of displaying standard candlesticks, this indicator plots price bars using over 34 different moving average calculations, along with the traditional Heiken Ashi chart and the renowned Kagi chart. This unique approach provides traders with smoothed price visualization that filters out market noise while maintaining critical trend information.
What Makes Candles Different
Traditional candlestick charts show raw price movements, which often include significant noise that can make trend identification challenging. Candles addresses this by reconstructing the Open, High, Low, and Close values of each bar using moving average calculations. This smoothing effect helps traders focus on the underlying trend rather than minor price fluctuations.
Three Input Parameters Explained
The indicator operates with three primary parameters that control how the moving averages behave:
MovingAveragePeriod (Default: 21) This parameter determines the lookback period for calculating the moving averages. A period of 21 means the indicator considers the previous 21 bars when computing each moving average value. Smaller periods (like 10-14) create more responsive charts that react quickly to price changes, while larger periods (30-50) produce smoother charts that emphasize longer-term trends. Traders can adjust this value based on their trading timeframe and strategy requirements.
SecondParam (Default: 1.0) Several moving average types require additional mathematical parameters to fine-tune their calculations. The SecondParam serves this purpose for specific algorithms including T3, T3_basic, REMA (Regularized EMA), JSmooth (Jurik Smoothing), and ALMA (Arnaud Legoux Moving Average). For T3 variants, this value controls the volume factor in the calculation, affecting how aggressively the average smooths price data. For REMA, it represents the lambda coefficient that regulates the smoothing behavior. For ALMA, it determines the offset parameter that influences where the average focuses within the lookback window. Values typically range between 0.5 and 1.0, with higher values generally producing smoother results.
ThirdParam (Default: 5) This parameter provides additional control for moving averages that require a third input value. Currently, it affects ALMA and Laguerre filter calculations. For ALMA, ThirdParam sets the sigma value, which controls the width of the Gaussian distribution used in the calculation. For the Laguerre filter, it determines the order of the filter, essentially deciding how many stages of filtering are applied to the price data. Higher orders produce smoother outputs but may introduce more lag.
Available Moving Average Types
The indicator includes an extensive selection of 34 moving average algorithms, each offering distinct characteristics:
Basic Averages: Simple Moving Average (SMA), Exponential Moving Average (EMA), Smoothed Moving Average (SMMA), Linear Weighted Moving Average (LWMA), and Wilder's Moving Average provide foundational smoothing options that most traders are familiar with.
Advanced Smoothing: Hull Moving Average (HMA), Zero-Lag EMA, Double Exponential Moving Average (DEMA), Triple Exponential Moving Average (TEMA), Double Smoothed EMA, and Triple Smoothed EMA offer reduced lag while maintaining smooth price action.
Volume-Based: Volume Weighted Moving Average (VWMA), Elastic Volume Weighted Moving Average (eVWMA), and Volume-weighted Exponential Moving Average (VEMA) incorporate volume data into their calculations, giving more weight to periods with higher trading activity.
Specialized Filters: T3, T3_basic, JSmooth (Jurik Smoother), Laguerre filter, Butterworth filters (BF2P and BF3P), SuperSmoother, and Decycler provide sophisticated filtering techniques developed for specific market analysis purposes.
Regression-Based: Least Square Moving Average (LSMA), Integral of Linear Regression Slope (ILRS), and IE/2 (combination of LSMA and ILRS) use linear regression mathematics to project trend direction.
Geometric and Statistical: Sine Weighted Moving Average, Triangular Moving Average (TriMA), Generalized TriMA, Moving Median, Geometric Mean, and ALMA employ unique mathematical approaches to price averaging.
Adaptive Methods: Regularized EMA (REMA), Instantaneous Trendline (ITrend), and Exponential Weighted Moving Average (EWMA) adjust their behavior based on market conditions.
Heiken Ashi Integration
Beyond moving average charts, Candles includes the popular Heiken Ashi charting method. Heiken Ashi bars are calculated using averaged price values, which smooths out standard candlesticks and makes trends easier to identify. The technique uses modified formulas for Open, High, Low, and Close values that incorporate previous bar data. This creates a visual representation where trending markets show consecutive bars of the same color, making trend continuation and reversal patterns more apparent.
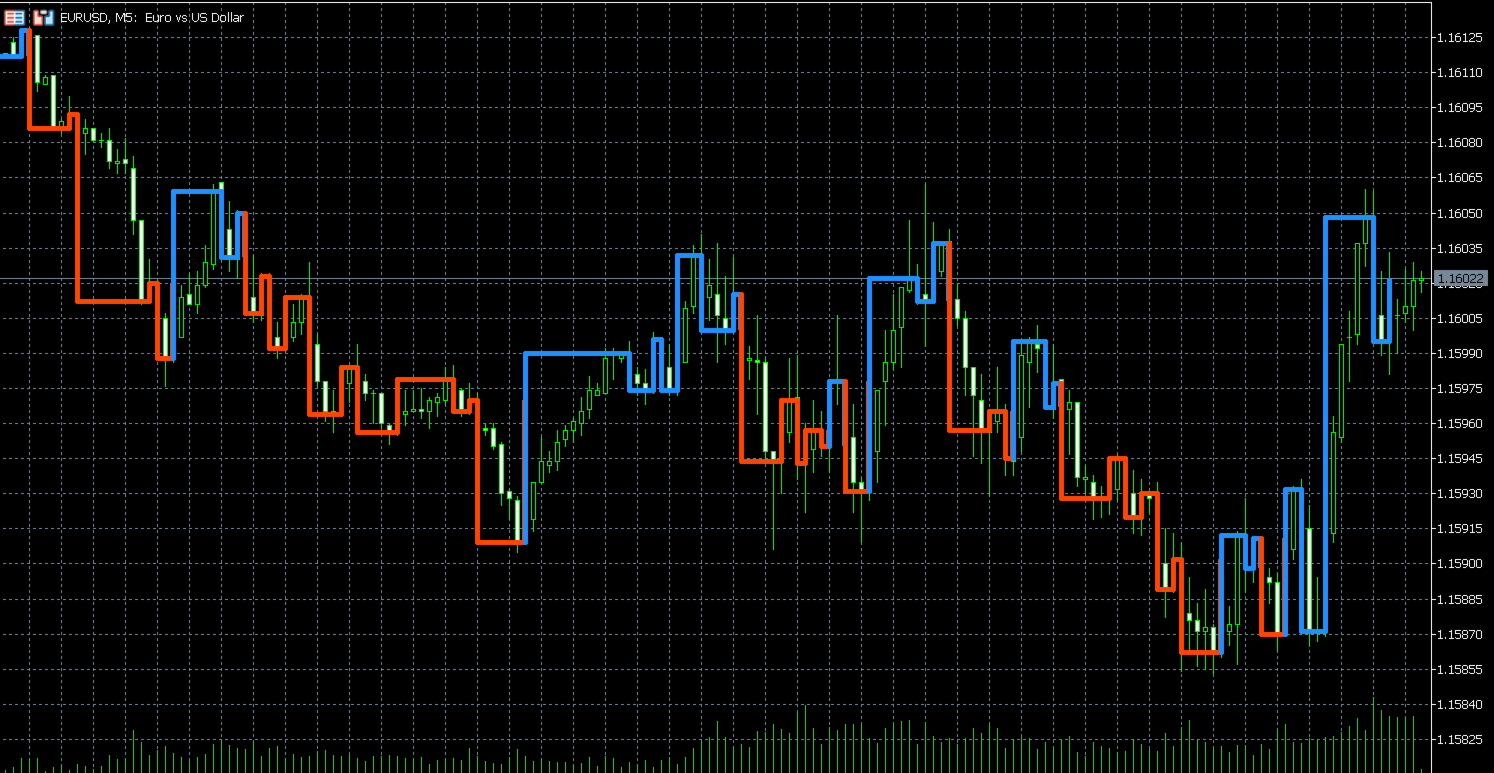
Kagi Chart Implementation
The Kagi chart is a Japanese charting technique that focuses on price movement independent of time. Unlike time-based charts where each bar represents a fixed time period, Kagi charts only create new lines when price moves by a predetermined amount (the Delta parameter).
The Kagi implementation in this indicator uses the Delta input to set the reversal threshold. When price moves beyond this threshold in the opposite direction, the chart draws a new line segment and potentially changes color to indicate trend direction. Thick lines (or specific colors) represent upward movement, while thin lines (or different colors) show downward movement. These thickness or color changes occur when price breaks through previous significant highs or lows, signaling potential trend reversals.
The MaxBars parameter in the Kagi section limits how many bars back the indicator will calculate, which helps manage computational resources on longer timeframes or when using large historical datasets.
Practical Applications
Traders can use Candles in multiple ways depending on their strategy:
Trend Identification: Moving average charts naturally smooth price action, making trend direction clearer. The smoother the average type selected, the easier it becomes to identify the primary trend without distraction from minor retracements.
Support and Resistance: The reconstructed High and Low values from moving averages can serve as support and resistance levels, as they represent averaged extremes rather than single price spikes.
Entry and Exit Signals: Color changes in the chart indicate when the moving average-based Close crosses above or below the Open, suggesting momentum shifts that could signal entry or exit opportunities.
Multi-Timeframe Analysis: By applying different moving average periods or types, traders can observe how price behaves across various smoothing levels, similar to analyzing multiple timeframes simultaneously.
Noise Reduction: In volatile or choppy markets, the smoothed bars help filter out false signals that might appear on standard charts.
Color Coding System
The indicator uses a two-color system to represent market direction. Bullish bars (where the moving average Close is above the Open) display in one color (default: Dodger Blue), while bearish bars show in another (default: Red). This visual distinction makes it immediately obvious whether the smoothed price action is moving up or down, allowing for quick chart analysis.
Alert System
Candles includes a built-in alert system that notifies traders when trend changes occur based on the selected moving average chart type. The indicator monitors color changes in the bars and can trigger alerts through multiple channels:
- Standard MetaTrader pop-up alerts
- Mobile push notifications
- Email notifications
Traders can configure which alert methods to use and set parameters for alert timing, including whether to alert on the current bar or wait for bar confirmation. This feature ensures traders don't miss potential trading opportunities when they're away from their charts.
Technical Considerations
The indicator processes each moving average calculation for all four price components (Open, High, Low, Close), ensuring that the relationship between these values remains mathematically consistent. This attention to detail preserves the integrity of chart patterns and technical analysis techniques that rely on bar structure.
For moving averages that require multiple stages of calculation (like DEMA, TEMA, or T3), the indicator maintains separate buffers for intermediate values, ensuring accurate computation even when new bars form.
Conclusion
Candles represents a powerful tool for traders seeking alternative ways to visualize price action. By offering 32+ moving average chart types, Heiken Ashi, and Kagi charting in a single indicator, it provides flexibility to match various trading styles and market conditions. Whether you prefer the simplicity of SMA charts, the responsiveness of Hull Moving Average, the volume integration of VWMA, or the time-independent structure of Kagi, this indicator delivers clean, noise-filtered chart visualization that can enhance your technical analysis and trading decisions.
The three adjustable parameters give traders control over how aggressively the indicator smooths price data, allowing customization for different instruments, timeframes, and volatility environments. From scalping on lower timeframes to position trading on daily charts, Candles adapts to meet your analytical needs.