Fast signals

Fast Signals 

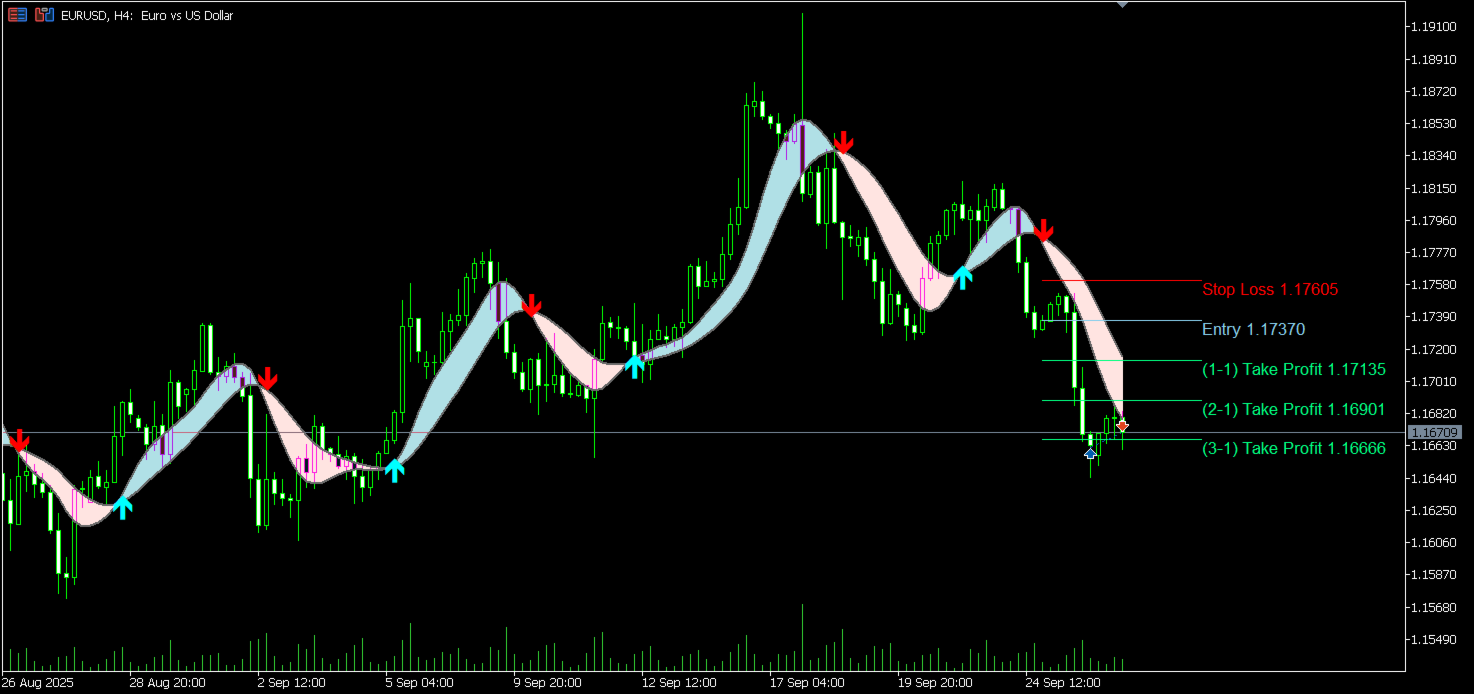
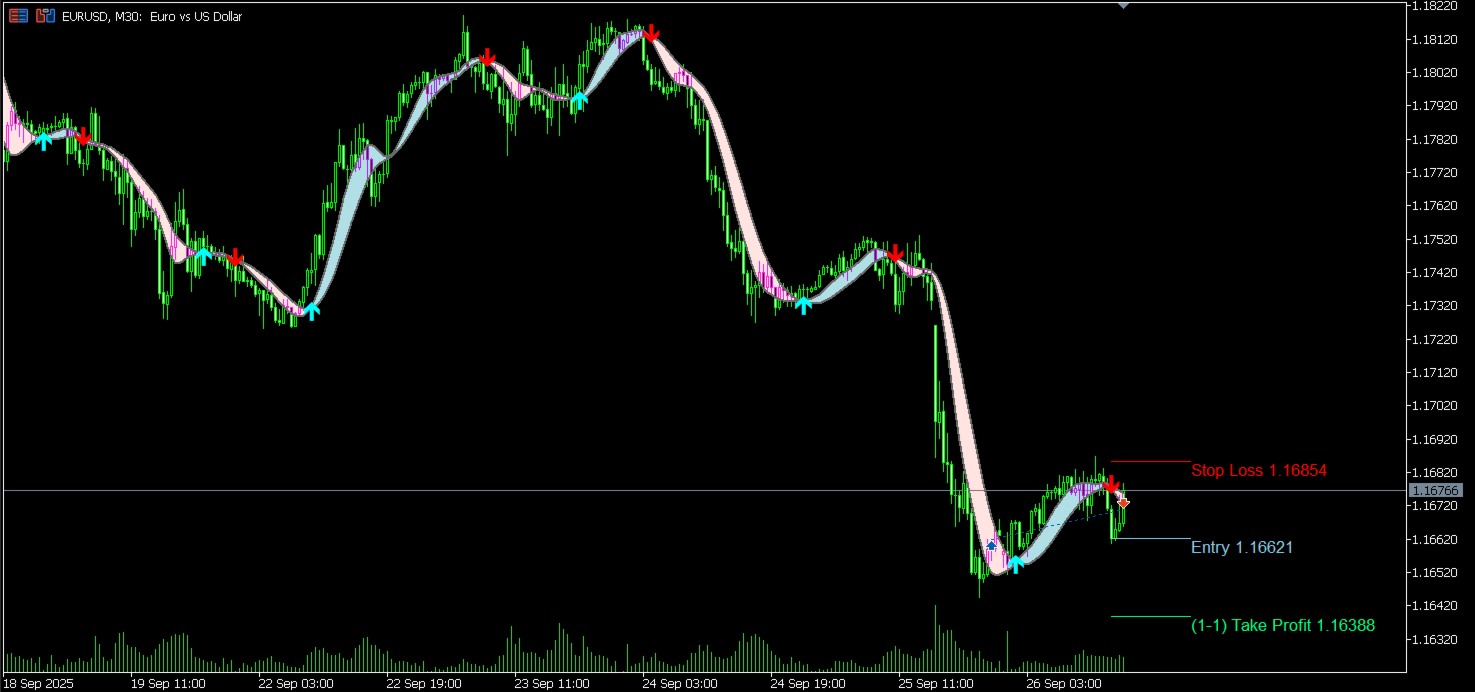
Summary Fast Signals is a dual Tillson T3 trend-and-signal indicator that paints a clear T3 ribbon on the main chart and plots buy/sell arrows on validated crossovers. It also provides optional risk overlays: entry, stop-loss, and three take-profit levels, so you can visualize trade plans directly on the chart. 

if you do not understand how to use technical support via product feedback or the MQL5 messaging system.

How it works

  • Two T3 lines are calculated: a fast T3 and a slow T3.
  • The ribbon (filling) shows the current trend bias: bullish when the fast T3 is above the slow T3, bearish when below.
  • A buy signal is plotted when the fast T3 crosses above the slow T3 while the ribbon is bullish.
  • A sell signal is plotted when the fast T3 crosses below the slow T3 while the ribbon is bearish.
  • Optional TP/SL/Entry lines are drawn automatically at signal time to support disciplined execution.

Key features

  • Clear crossover signals with arrow markers (configurable arrow codes).
  • Visual T3 ribbon for quick trend confirmation.
  • Built-in risk lines: Entry, SL and three TP targets (1:1, 2:1, 3:1 relative to SL%).
  • Highly configurable: T3 periods, smoothing (“Hot”), original Tillson option, colors, widths, and styles.
  • Lightweight and suitable for multiple timeframes and symbols.
  • Auto-cleanup of TP/SL objects when removing the indicator to keep charts tidy.
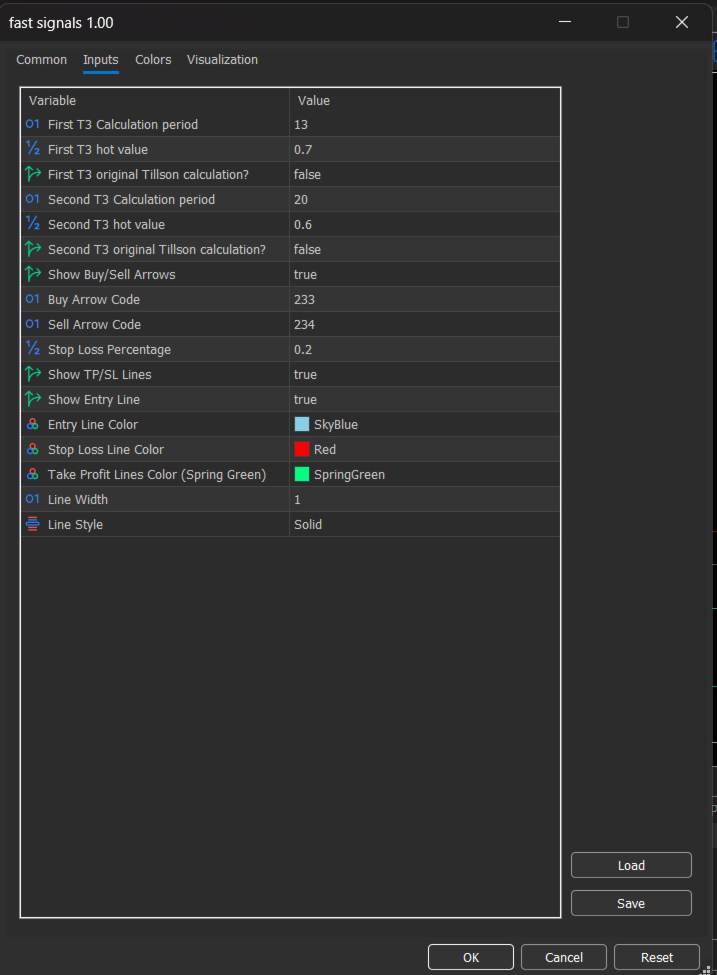
Inputs

  • T3 settings:
    • T3Period1, T3Hot1, T3Original1: fast T3 period, smoothing factor, and original-formula option.
    • T3Period2, T3Hot2, T3Original2: slow T3 period, smoothing factor, and original-formula option.
  • Signals:
    • ShowArrows: show/hide buy/sell arrows.
    • ArrowCode_Buy, ArrowCode_Sell: arrow symbol codes (defaults 233 up, 234 down).
  • Risk overlay:
    • StopLossPercent: SL percentage relative to entry price (e.g., 1.0 = 1%).
    • ShowTPSL: show/hide TP/SL lines.
    • ShowEntry: show/hide the entry line.
  • Visuals:
    • EntryColor, StopLossColor, TakeProfitColor: colors for entry/SL/TP lines.
    • LineWidth: TP/SL line thickness.
    • LineStyle: TP/SL line style.

Usage tips

  • Confirm at bar close: signals are most reliable after the bar that triggers the crossover closes.
  • Adapt to timeframe: increase T3 periods for higher timeframes, decrease for lower timeframes.
  • Risk-first approach: choose StopLossPercent to fit your risk plan; combine with proper position sizing and trade management.

Notes and limitations

  • Like any technical tool, signals can update while the current bar is open.
  • Use in conjunction with broader analysis (market structure, volatility, levels) for best results.
  • No external libraries or third-party dependencies.

Compatibility

  • Platform: MetaTrader 5
  • Window: Main chart window
  • Plots: T3 ribbon, two T3 lines, buy/sell arrows, optional TP/SL/Entry overlay

if you do not understand how to use technical support via product feedback or the MQL5 messaging system.


Prodotti consigliati
Introduction This indicator detects volume spread patterns for buy and sell opportunity. The patterns include demand and supply patterns. You might use each pattern for trading. However, these patterns are best used to detect the demand zone (=accumulation area) and supply zone (=distribution area). Demand pattern indicates generally potential buying opportunity. Supply pattern indicates generally potential selling opportunity. These are the underlying patterns rather than direct price action. T
Trading Session Dashboard
Marwan Bin Mohammed Al Eid Bin Mohammed Carpenter
The Trading Sessions Dashboard is a powerful and user-friendly MT5 indicator designed to provide traders with real-time insights into the major forex trading sessions. It displays the status of each session (Active or Closed) along with the remaining time until closure or the next opening, helping you align your trading strategy with market hours. Built for clarity and professionalism, this indicator is perfect for beginners and experienced traders alike, ensuring you never miss key session tran
Potenzia la tua analisi con un solo sguardo! Questo indicatore disegna automaticamente i livelli chiave in cui il prezzo ha recentemente rimbalzato o rotto, fornendo zone oggettive di supporto e resistenza senza doverle tracciare manualmente. Basta applicarlo al tuo grafico per vedere le linee degli alti e bassi precedenti di ciascun periodo. Cosa rappresenta ogni linea? Previous Month High ‣ Massimo del mese precedente: prezzo più alto registrato nel periodo mensile precedente. Previous Month
Harmonic Pro
Kambiz Shahriarynasab
Only 5 copies of the EA at $30! Next price --> $45 Find charts and signals based on harmonic patterns, which work great in 1-hour timeframes and up. Buy and sell signs based on different harmonic patterns as follows: 0: ABC_D 1: ABCD_E 2: 3Drive 3: 5_0 4: Gartley 5: Bat 6: Crab 7: Butterfly 8: Cypher 9: NenStar 10: Shark 11: AntiBat 12: AntiGartley 13: AntiCrab 14: AntiButterfly 15: AntiCypher 16: AntiNenStar 17: AntiShark How to use: When there is an opportunity to buy or sell, you have 5:
1. Why did I develop this series of indicators I found that most traders need to use multiple time frame indicators. They usually switch time frame to see indicators. However, once the timeframe is switched, you cannot see the  corresponding relationship  between  the price in the smaller timeframe  and  the indicator in the larger timeframe . For example: if your price chart is in H1 timeframe, you can see H4, D1 and W1 indicators in H1 timeframe Chart. This is more helpful for you to find th
Visual Aroon Zero Level Indicator
AL MOOSAWI ABDULLAH JAFFER BAQER
The Visual Aroon Zero Level Indicator is a powerful analytical tool designed to assist traders in identifying market trends, momentum, and potential reversals using the robust Aroon oscillator logic. It offers clear and actionable insights, making it an essential addition to your trading toolkit. Key Features and Logic Behind the Indicator: Aroon Oscillator Mechanics: The Aroon Oscillator operates by analyzing the time since the most recent highs and lows occurred. The indicator calculates the
Volume Delta Panel  is a very powerful indicator that read the supply on Market. It calculates the Delta from movement of the price and the difference of BUY volumes and SELL volumes. The Volumes are added to price and normalized to symbol points.  Its special structure allows you to get all Time Frames values available on the platform MT5. Panel can show 50 instruments simultaneously all customizable according to the offer of the Broker. A good observation of this instrument can suggest great e
UT Bot Alerts with ATR Trailing Stop is a professional trading tool that automatically detects trend changes and generates precise buy/sell signals using a smart ATR-based trailing stop system. Key Benefits Smart Alert System - Instant notifications when trading opportunities appear - Multiple alert types: popup, sound, email, and mobile push - No duplicate alerts - prevents spamming - Customizable alerts for buy signals, sell signals, or both Accurate Signal Detection - Dual confirmation syste
The 4 headed dragon is an indicator that has two functions. 1) Set the background trend. 2) Mark the predominant trend. By combining these two indicator signals, we will be able to trade for or against the trend, adapting the signals to your reading of the market. You can download the demo and test it yourself. 1) Set the background trend.    Define four possibilities of trend that are the four heads of the dragon, marked by colors on the indicator, marking a) Powerful buying trend. b) Weak
Ultimate World Clock
Mehdi Ghorbani Saeidian
Every Trader trades in a market zone. If you are not living in the time zone you are trading, you need a clock to show you what time it is in your favorite time zone, and it should be small at the same time to not interrupt your trading process.  In this small indicator, you have access to 3 major clocks around the world, and you can easily look at them. We have some other products that I am sure will help you with your trading career. Please have a look at the link: LINK our all-in-one trading
Scopri i veri schemi nascosti del mercato con il sistema di trading PREDATOR AURORA — il boss finale degli indicatori di trading ibridi. Vedi ciò che gli altri non vedono! Il sistema di trading PREDATOR AURORA è una potenza progettata per coloro che si rifiutano di nascondersi nell'ombra della mediocrità. Questo non è solo un altro indicatore; è il codice di cheat; è il tuo vantaggio sleale, un sofisticato sistema ibrido di caccia che traccia i movimenti del mercato con precisione letale in u
About indicator > The indicator is a function based on one value (open/high prices up to now) and then it is a mathematical representation of the whole function that is totally independent from any else values. So, if you ask yourself will the future be as it is on the graph... I can tell you - as it was the same as the trading function up to the moment "now"... In conclusion, the point of the indicator is  to try to show the future of the trading function into eternity. The graphic is sometime
1. Why did I develop this series of indicators I found that most traders need to use multiple time frame indicators. They usually switch time frame to see indicators. However, once the timeframe is switched, you cannot see the  corresponding relationship  between  the price in the smaller timeframe  and  the indicator in the larger timeframe . For example: if your price chart is in H1 timeframe, you can see H4, D1 and W1 indicators in H1 timeframe Chart. This is more helpful for you to find th
Please,put CycleDivergence in the same folder of TimingCycleWithLLV otherwise it does not run. As for the cycle discussion, I invite you to read the TimingCycleWithLLV indicator presentation ...please ask me if something is not clear. I think tha time is much more important than price;this is the reason for wich I trade only when one cycle finishes and the new one start. In order to use the CycleDivergence indicator follow these steps: 1) for example (see imagine number four) 1 minute chart,in t
VOLUME PROFILE SAF-XII                            Professional Market Profile Analysis for MT5  (dream indicator for Grid-style traders)          WHAT IS VOLUME PROFILE? Volume Profile is a professional institutional tool that displays trading activity at specific price levels, unlike traditional volume indicators that show volume over time. It reveals WHERE trading occurred, within your window of choice, helping identify:   • FAIR VALUE AREAS (VAH/VAL) - Price levels where most tradin
Hello Seasonal Traders! The seasonality trading strategy works because the smart money is doing the same thing every single year more often than not. The month of the year or the day of the week and the time of the day can call the shots in any market.   The seasonal cycle is another useful tool in your trading arsenal. I'm not saying to trade solely off of seasonality and forget anything else. I'm only giving you another trading tool that you can incorporate into your own trading strategy to ga
Grabber System MT5
Ihor Otkydach
4.83 (23)
Ti presento un eccellente indicatore tecnico: Grabber, che funziona come una strategia di trading "tutto incluso", pronta all’uso. In un solo codice sono integrati strumenti potenti per l’analisi tecnica del mercato, segnali di trading (frecce), funzioni di allerta e notifiche push. Ogni acquirente di questo indicatore riceve anche gratuitamente: L’utility Grabber: per la gestione automatica degli ordini aperti Video tutorial passo dopo passo: per imparare a installare, configurare e utilizzare
UT Bot Alerts MT5
Mohammad Taher Halimi Tabrizi
5 (2)
This indicator is converted from UT Bot alerts indicator by @QuantNomad of Trading View to MT5. its considering ATR and creating new candles on chart and also is giving good entry points based on its candles. all buffers of new candles and also entry signals are included as buffer so can be used easily on any EA. there are also some different strategies on the internet that can be used or contact me to create it for you.
1. Why did I develop this series of indicators I found that most traders need to use multiple time frame indicators. They usually switch time frame to see indicators. However, once the timeframe is switched, you cannot see the  corresponding relationship  between  the price in the smaller timeframe  and  the indicator in the larger timeframe . For example: if your price chart is in H1 timeframe, you can see H4, D1 and W1 indicators in H1 timeframe Chart. This is more helpful for you to find th
Uno dei pochi indicatori che calcola i livelli esclusivamente in base al prezzo. L’indicatore non è influenzato dai timeframe, dai trend o dai cicli di mercato. Uno degli indicatori più logici mai creati. L’indicatore FIFTY è ora disponibile in una versione automatica, che elimina la necessità di tracciare manualmente i livelli. Questa versione disegna automaticamente sul grafico i livelli giornalieri, settimanali, mensili e annuali, garantendo precisione e risparmio di tempo. Inoltre, sono pres
Schaff trend RSI indicator (It is related with EMA and RSI) It is suited for sub-Indicator to undertand trend(or direction change) As you can see the screenshot, it's good with Nagaraya-Watson Envelope Indicator (or others) I am using this indicator as Screenshot setting. (Schaff value is default value. 23, 50, 9, close) If you want to get Nagaraya-Watson Envelope, Link:  https://www.mql5.com/ko/market/product/97965
Adjustable Consecutive Fractals  looks for 2 or more fractals in one direction and sends out a on screen alert, sound alert and push notification, for strong reversal points . Adjustable Consecutive Fractals, shows the fractals on chart along with a color changing text for buy and sell signals when one or more fractals appear on one side of price. Adjustable Consecutive Fractals is based Bill Williams Fractals . The standard Bill Williams fractals are set at a non adjustable 5 bars, BUT withe th
1. Why did I develop this series of indicators I found that most traders need to use multiple time frame indicators. They usually switch time frame to see indicators. However, once the timeframe is switched, you cannot see the  corresponding relationship  between  the price in the smaller timeframe  and  the indicator in the larger timeframe . For example: if your price chart is in H1 timeframe, you can see H4, D1 and W1 indicators in H1 timeframe Chart. This is more helpful for you to find th
CChart
Rong Bin Su
Overview In the fast-paced world of forex and financial markets, quick reactions and precise decision-making are crucial. However, the standard MetaTrader 5 terminal only supports a minimum of 1-minute charts, limiting traders' sensitivity to market fluctuations. To address this issue, we introduce the Second-Level Chart Candlestick Indicator , allowing you to effortlessly view and analyze market dynamics from 1 second to 30 seconds on a sub-chart. Key Features Support for Multiple Second-Level
Currency strength meter gives you a quick visual guide to which currencies are currently strong, and which ones are weak. The meter measures the strength of all forex cross pairs and applies calculations on them to determine the overall strength for each individual currency.We calculate based the strength of currency based on the trend of 28 pairs. LIMITED TIME OFFER : Trend CSM Indicator is available for only 50 $. ( Original price 125$ ) By accessing to our MQL5 Blog,  you can find all our p
1. Why did I develop this series of indicators I found that most traders need to use multiple time frame indicators. They usually switch time frame to see indicators. However, once the timeframe is switched, you cannot see the  corresponding relationship  between  the price in the smaller timeframe  and  the indicator in the larger timeframe . For example: if your price chart is in H1 timeframe, you can see H4, D1 and W1 indicators in H1 timeframe Chart. This is more helpful for you to find th
Gli utenti di questo prodotto hanno anche acquistato
SuperScalp Pro
Van Minh Nguyen
4.61 (23)
SuperScalp Pro – Sistema avanzato di indicatore scalping multi-filtro SuperScalp Pro è un indicatore di scalping avanzato che combina il classico Supertrend con molteplici filtri intelligenti di conferma per aiutare a identificare opportunità di trading. Funziona in modo efficiente su diversi timeframe da M1 a H4, con prestazioni ottimizzate su XAUUSD, BTCUSD e principali coppie Forex. L’indicatore fornisce chiari segnali Buy e Sell, insieme a livelli di ingresso, stop loss e take profit calcola
Entry In The Zone and SMC Multi Timeframe is a real-time 2-in-1 market analysis tool that combines market structure analysis and a No Repaint BUY / SELL signal system into a single indicator, built on Smart Money Concepts (SMC) — a widely adopted framework used by professional traders to understand market structure. This indicator helps you see the market more clearly, make decisions based on structure rather than guesswork, and focus on high-probability zones where price is more likely to react
SignalTech MT5 is a trading system for EURUSD, USDCHF, USDJPY, AUDUSD, NZDUSD, EURJPY, AUDJPY, NZDJPY, CADJPY H2 and H3 Timeframe.  All the winning trades with chart setups are published on the comments page. 2025-12 1174 Pips 2026-01 2624 Pips 2026-02 2937 Pips 2026-03 2165 Pips 2026-04 2243 Pips It can generate signals with Buy/Sell Arrows and Pop-Up/Sound Alerts. Each signal has clear Entry and Stop Loss levels, which should be automatically flagged on the chart, as well as potential Targets
Azimuth Pro
Ottaviano De Cicco
5 (7)
Azimuth Pro V2: Synthetic Fractal Structure and Confirmed Entries for MT5 Overview Azimuth Pro is a multi-level swing structure indicator by Merkava Labs . Four nested swing layers, swing-anchored VWAP, ABC pattern detection, three-timeframe structural filtering, and closed-bar confirmed entries — one chart, one workflow from micro-swings to macro-cycles. This is not a blind signal product. It is a structure-first workflow for traders who care about location, context, and timing. V2 Launch Offe
Divergence Bomber
Ihor Otkydach
4.9 (87)
Ogni acquirente dell’indicatore riceverà inoltre gratuitamente: L’utilità esclusiva “Bomber Utility”, che gestisce automaticamente ogni operazione, imposta i livelli di Stop Loss e Take Profit e chiude le posizioni secondo le regole della strategia I file di configurazione (set file) per adattare l’indicatore a diversi asset I set file per configurare il Bomber Utility in tre modalità: “Rischio Minimo”, “Rischio Bilanciato” e “Strategia di Attesa” Una guida video passo-passo per installare, conf
Power Candles MT5
Daniel Stein
5 (8)
Power Candles V3 - Indicatore di forza ad ottimizzazione automatica Power Candles V3 trasforma la forza delle valute e degli strumenti in un piano di trading attuabile su ogni grafico a cui è collegato. Invece di limitarsi a colorare le candele, esegue un'auto-ottimizzazione in tempo reale in background e ti fornisce i migliori valori di Stop Loss, Take Profit e soglia di segnale per il simbolo che hai davanti. Basta un clic per adottarlo nel trading live: i raggi di ingresso, Stop Loss e Take P
FX Trend MT5 NG
Daniel Stein
5 (4)
FX Trend NG: La Nuova Generazione di Intelligenza di Trend Multi-Mercato Panoramica FX Trend NG è uno strumento professionale di analisi del trend multi-timeframe e monitoraggio dei mercati. Ti consente di comprendere la struttura completa del mercato in pochi secondi. Invece di passare tra numerosi grafici, puoi identificare immediatamente quali strumenti sono in trend, dove il momentum sta diminuendo e dove esiste un forte allineamento tra i timeframe. Offerta di Lancio – Ottieni FX Trend NG
Quantum TrendPulse
Bogdan Ion Puscasu
5 (23)
Ecco   Quantum TrendPulse   , lo strumento di trading definitivo che combina la potenza di   SuperTrend   ,   RSI   e   Stocastico   in un unico indicatore completo per massimizzare il tuo potenziale di trading. Progettato per i trader che cercano precisione ed efficienza, questo indicatore ti aiuta a identificare con sicurezza le tendenze di mercato, i cambiamenti di momentum e i punti di entrata e uscita ottimali. Caratteristiche principali: Integrazione SuperTrend:   segui facilmente l'andame
Gann Made Easy è un sistema di trading Forex professionale e facile da usare che si basa sui migliori principi del trading utilizzando la teoria di mr. WD Gann. L'indicatore fornisce segnali ACQUISTA e VENDI accurati, inclusi i livelli di Stop Loss e Take Profit. Puoi fare trading anche in movimento utilizzando le notifiche PUSH. CONTATTAMI DOPO L'ACQUISTO PER RICEVERE GRATUITAMENTE LE ISTRUZIONI DI TRADING E OTTIMI INDICATORI EXTRA! Probabilmente hai già sentito parlare molte volte dei metodi d
Se acquisti questo indicatore, riceverai il mio Trade Manager Professionale + EA  GRATUITAMENTE. Innanzitutto è importante sottolineare che questo sistema di trading è un indicatore Non-Repainting, Non-Redrawing e Non-Lagging, il che lo rende ideale sia per il trading manuale che per quello automatico. Corso online, manuale e download di preset. Il "Sistema di Trading Smart Trend MT5" è una soluzione completa pensata sia per i trader principianti che per quelli esperti. Combina oltre 10 indicat
Innanzitutto, vale la pena sottolineare che questo Strumento di Trading è un Indicatore Non-Ridipingente, Non-Ridisegnante e Non-Laggante, il che lo rende ideale per il trading professionale. Corso online, manuale utente e demo. L'Indicatore Smart Price Action Concepts è uno strumento molto potente sia per i nuovi che per i trader esperti. Racchiude più di 20 utili indicatori in uno solo, combinando idee di trading avanzate come l'Analisi del Trader del Circolo Interno e le Strategie di Tradin
Btmm state engine pro
Garry James Goodchild
5 (4)
BTMM State Engine Pro is a MetaTrader 5 indicator for traders who use the Beat The Market Maker approach: Asian session context, kill zone timing, level progression, peak formation detection, and a multi-pair scanner from a single chart. It combines cycle state logic with a built-in scanner dashboard so you do not need the same tool on many charts at once. What it does Draws the Asian session range; session times can follow broker server offset or be set in inputs. Tracks level progression (L
Questo cruscotto mostra gli ultimi   pattern armonici   disponibili per i simboli selezionati, in modo da risparmiare tempo ed essere più efficienti /   versione MT4 . Indicatore gratuito:   Basic Harmonic Pattern Colonne dell'indicatore Symbol :   vengono visualizzati i simboli selezionati Trend:   rialzista o ribassista Pattern:   tipo di pattern (gartley, butterfly, bat, crab, shark, cypher o ABCD) Entry:   prezzo di ingresso SL:   prezzo di stop loss TP1:   1 prezzo di take profit TP2:
Atomic Analyst MT5
Issam Kassas
3.94 (31)
Innanzitutto, vale la pena sottolineare che questo indicatore di trading non è repaint, non è ridisegno e non presenta ritardi, il che lo rende ideale sia per il trading manuale che per quello automatico. Manuale utente: impostazioni, input e strategia. L'Analista Atomico è un indicatore di azione del prezzo PA che utilizza la forza e il momentum del prezzo per trovare un miglior vantaggio sul mercato. Dotato di filtri avanzati che aiutano a rimuovere rumori e segnali falsi, e aumentare il pote
Meridian Pro
Ottaviano De Cicco
5 (1)
Meridian Pro 2.00: Professional Multi-Timeframe Trend Matrix for MT5 Meridian Pro 2.00 is a professional adaptive trend matrix for MetaTrader 5. It combines the original Meridian trend engine, a clean chart ribbon, closed-bar signal arrows, an 8-timeframe dashboard, Fuel momentum, weighted consensus, synthetic HTF processing and chart-native higher-timeframe context lines. The goal is simple: read current trend, multi-timeframe structure, strength, momentum and EA-ready state from one discipline
OmniSync Projection
Antonio-alin Teculescu
5 (1)
Chronos Fractal Engine is an innovative price projection indicator for MetaTrader 5, designed to transform your technical analysis by intelligently identifying and projecting historical price patterns. Built upon an advanced correlation algorithm and the fractal principles of the market, this powerful tool visualizes potential future price movements, giving you a unique edge in your trading decisions. What is Chronos Fractal Engine? At its core, the Chronos Fractal Engine employs a sophisticat
Trend Screener Pro MT5
STE S.S.COMPANY
4.85 (104)
Indicatore di tendenza, soluzione unica rivoluzionaria per il trading di tendenze e il filtraggio con tutte le importanti funzionalità di tendenza integrate in un unico strumento! È un indicatore multi-timeframe e multi-valuta al 100% non ridipingibile che può essere utilizzato su tutti i simboli/strumenti: forex, materie prime, criptovalute, indici e azioni. Trend Screener è un indicatore di tendenza che segue un indicatore efficiente che fornisce segnali di tendenza a freccia con punti nel gra
FX Power MT5 NG
Daniel Stein
5 (31)
FX Power: Analizza la Forza delle Valute per Decisioni di Trading Più Intelligenti Panoramica FX Power è lo strumento essenziale per comprendere la reale forza delle principali valute e dell'oro in qualsiasi condizione di mercato. Identificando le valute forti da comprare e quelle deboli da vendere, FX Power semplifica le decisioni di trading e rivela opportunità ad alta probabilità. Che tu segua le tendenze o anticipi inversioni utilizzando valori estremi di Delta, questo strumento si adatta
Presentazione       Quantum Breakout PRO   , l'innovativo indicatore MQL5 che sta trasformando il modo in cui scambi le zone di breakout! Sviluppato da un team di trader esperti con un'esperienza di trading di oltre 13 anni,       Quantum Breakout PRO       è progettato per spingere il tuo viaggio di trading a nuovi livelli con la sua strategia innovativa e dinamica della zona di breakout. Quantum Breakout Indicator ti fornirà frecce di segnalazione sulle zone di breakout con 5 zone target di
Market Structure Patterns
Samuel Manoel De Souza
4.47 (19)
Market Structure Patterns   è un indicatore basato sui   Smart Money Concepts   che mostra gli   elementi SMC/ICT   che possono portare le tue decisioni di trading a un livello superiore. Approfitta di   alert ,   notifiche push   e   email   per essere avvisato quando si forma un elemento sul grafico, il prezzo supera un livello e/o entra in una zona. Gli sviluppatori possono accedere ai valori degli elementi dell’indicatore utilizzando le   variabili globali , consentendo l’automazione delle
Crystal Heikin Ashi Signals
Muhammad Jawad Shabir
5 (2)
Crystal Heikin Ashi Signals - Professional Trend & Signal Detection Indicator Advanced Heikin Ashi Visualization with Intelligent Signal System for Manual & Automated Trading Final Price: $149 ---------> Price goes up $10 after every 10 sales . Limited slots available — act fast . Overview Crystal Heikin Ashi Signals is a professional-grade MetaTrader 5 indicator that combines pure Heikin Ashi candle visualization with an advanced momentum-shift detection system. Designed for both manual traders
KT Alpha Hunter Arrows MT5
KEENBASE SOFTWARE SOLUTIONS
La maggior parte degli indicatori a frecce ti dà un segnale e poi ti lascia capire da solo tutto il resto. KT Alpha Hunter Arrows ti offre un piano di trading completo. Ogni freccia di segnale appare con un piano completo già disegnato: linea di ingresso, stop loss, quattro livelli di take profit e un verdetto live sull’edge, che ti indica se quel simbolo e quel timeframe meritano davvero di essere tradati in quel momento. Il Trade Manager EA incluso gestisce l’esecuzione dopo il tuo ingresso, c
Trend indicator AI mt5
Ramil Minniakhmetov
5 (17)
Trend Ai indicator è un ottimo strumento che migliorerà l'analisi di mercato di un trader combinando l'identificazione della tendenza con punti di ingresso utilizzabili e avvisi di inversione. Questo indicatore consente agli utenti di navigare nelle complessità del mercato forex con fiducia e precisione Oltre ai segnali primari, l'indicatore Ai di tendenza identifica i punti di ingresso secondari che si presentano durante i pullback o i ritracciamenti, consentendo ai trader di capitalizzare le
ARICoins
Temirlan Kdyrkhan
ARICoin is a powerful trading companion designed to generate high-probability entry signals with dynamic TP/SL/DP levels based on volatility. Built-in performance tracking shows win/loss stats, PP1/PP2 hits, and success rates all updated live. Key Features: Buy/Sell signals with adaptive volatility bands Real-time TP/SL/DP levels based on ATR Built-in MA Filter with optional ATR/StdDev volatility Performance stats panel (Success, Profit/Loss, PP1/PP2) Alerts via popup, sound, push, or email Cust
Gartley Hunter Multi
Siarhei Vashchylka
5 (11)
Gartley Hunter Multi - An indicator for searching for harmonic patterns simultaneously on dozens of trading instruments and on all possible timeframes. Manual (Be sure to read before purchasing) | Version for MT4 Advantages 1. Patterns: Gartley, Butterfly, Shark, Crab. Bat, Alternate Bat, Deep Crab, Cypher 2. Simultaneous search for patterns on dozens of trading instruments and on all possible timeframes 3. Search for patterns of all possible sizes. From the smallest to the largest 4. All fou
Auto Optimized Parabolic RSI: Motore di Momentum 3D Avanzato La maggior parte degli indicatori per trader privati fallisce perché si affida a parametri statici che smettono di funzionare nel momento in cui la volatilità del mercato cambia. Auto Optimized Parabolic RSI risolve il problema dell'"obsolescenza dell'indicatore" ricalcolando continuamente il proprio vantaggio matematico, portando un adattamento quantitativo di livello istituzionale direttamente sul tuo terminale MT5. Il Vantaggio Prin
Super Signal Market Slayer No repaint | Alta precisione | Indicatore di trend intelligente multi-mercato Nel trading, la vera difficoltà non è aprire un’operazione, ma riconoscere chiaramente quando un trend sta realmente iniziando. Market Slayer nasce proprio per questo. È un indicatore intelligente senza repaint, progettato specificamente per il trading intraday. Grazie a conferme multilivello e filtri di trend, fornisce segnali Buy / Sell chiari e affidabili solo nei momenti chiave. Vantaggi
Top indicator for MT5   providing accurate signals to enter a trade without repainting! It can be applied to any financial assets:   forex, cryptocurrencies, metals, stocks, indices .  Watch  the video  (6:22) with an example of processing only one signal that paid off the indicator! MT4 version is here It will provide pretty accurate trading signals and tell you when it's best to open a trade and close it. Most traders improve their trading results during the first trading week with the help of
Current event:  https://c.mql5.com/1/326/A2SR2025_NoMusic.gif A2SR per MT5 Indicatore: Domanda e Offerta Effettive Automatizzate (S/R). + Strumenti di Trading. Product description in English here. --   Guidance   : -- at   https://www.mql5.com/en/blogs/post/734748/page4#comment_16532516 -- and  https://www.mql5.com/en/users/yohana/blog Potente, Autentico e Risparmio di Tempo per Decisioni di Trading più Intelligenti + Oggetti compatibili con EA. Vantaggi Principali Livelli di SR Effettivi
Trend Lines PRO MT5
Roman Podpora
5 (1)
LINEE DI TENDENZA PRO  Aiuta a capire dove il mercato sta realmente cambiando direzione. L'indicatore mostra reali inversioni di tendenza e punti in cui i principali operatori rientrano. Vedi   Linee BOS   Cambiamenti di tendenza e livelli chiave su timeframe più ampi, senza impostazioni complesse o rumore inutile. I segnali non vengono ridisegnati e rimangono sul grafico dopo la chiusura della barra. VERSIONE MT4   -   Svela il suo massimo potenziale se abbinato all'indicatore   RFI LEVELS PRO
Altri dall’autore
Trend Signals TP SL UAlgo This professional trading indicator combines two T3 moving averages with automated take profit and stop loss calculations to provide accurate trend signals and comprehensive risk management on MetaTrader 5. Main Algorithm The indicator uses two independently configurable T3 (Triple Exponential Moving Average) calculations with customizable periods and hot values. The T3 algorithm offers superior smoothing compared to traditional moving averages while maintaining res
ZOnepross
Firas Al-qasimi
ZonesPro – Advanced Supply  Demand / Support  Resistance Indicator for MT5 ZonesPro is a smart and powerful indicator designed to automatically detect supply and demand zones (also interpreted as support and resistance) directly on your MT5 chart. It uses Fractals to identify key market turning points and filters out weak or broken zones to keep your chart clean and focused on only the strongest levels.
ClearTrend Dashboard
Firas Al-qasimi
5 (1)
ClearTrend Dashboard Indicator V2.0 — Multi-Timeframe Trend Scanner ClearTrend Dashboard Indicator V2.0 is an indicator for MetaTrader 5 that displays market trends across multiple timeframes in a single dashboard. It combines exponential moving average and relative strength index analysis to provide a clear and rapid overview of market conditions. if you do not understand how to use technical support via product feedback or the MQL5 messaging system. Key Features  Multi-timeframe analysis: M1,
Kiobi
Firas Al-qasimi
KIOBI VISION KIOBI VISION is a multi-factor analysis indicator designed for professional traders who want a clear and structured view of the market across multiple time frames. Objective The indicator offers a unique summary table that combines several technical tools (RSI, MACD, Stochastics, Vortex, Momentum, PSAR, DMI, MFI, Fisher, and general trend) to provide reliable and quick-to-interpret buy and sell signals. Key Features Multi-timeframe analysis (M1 → MN): a consolidated view of the
NVP Oscillateur is a professional trading indicator designed to help traders identify overbought and oversold conditions in the market with high precision. Using optimized calculation algorithms, it provides a clear and easy-to-read oscillator that highlights potential market turning points.  Key Features: Fast detection of possible reversal zones. Effective in both trending and ranging markets. Clean and user-friendly visual display. Works on all instruments: Forex, indices, stocks, cryptocurr
SmartTrendATR
Firas Al-qasimi
SmartTrend ATR – Professional Trend Indicator  Overview ,don't forget to adjust the settings (inpShowLabels, true) SmartTrend ATR is an advanced trading indicator based on the SuperTrend algorithm combined with the ATR (Average True Range). It is designed to detect trend reversals and continuations with high accuracy, providing clear BUY/SELL signals suitable for scalping, day trading, swing trading, and long-term strategies.  if you don't understand how to use Technical Support via product fee
Algo octa
Firas Al-qasimi
Algo Octa - Indicateur d'Analyse Technique Avancé Indicateur professionnel combinant ZigZag, SAR parabolique, canaux de tendance et niveaux de Fibonacci pour une analyse technique complète.  if you don't understand how to use Technical Support via product feedback or MQL5 messaging system.  Fonctionnalités Principales Analyse Multi-Composants  ZigZag coloré avec détection automatique des extremums  Intégration du SAR parabolique pour la confirmation de tendance  Création automatique de canau
SmartWave
Firas Al-qasimi
A decision-support indicator for MetaTrader 5 that visualizes market structure using two complementary elements: adaptive Support/Resistance zones and a best-fit Trend Channel computed by regression. Zones scale with volatility (ATR and smoothed ATR) and update only after a pivot is validated, which helps filter noise. The channel shows prevailing slope and parallel boundaries based on average deviation; optional dotted alternatives provide additional confluence. The tool works on any symbol a
Filtro:
Nessuna recensione
Rispondi alla recensione