CycleDivergence
- Indicatori
- Versione: 1.1
- Aggiornato: 8 maggio 2019
- Attivazioni: 5

Please,put CycleDivergence in the same folder of TimingCycleWithLLV otherwise it does not run.
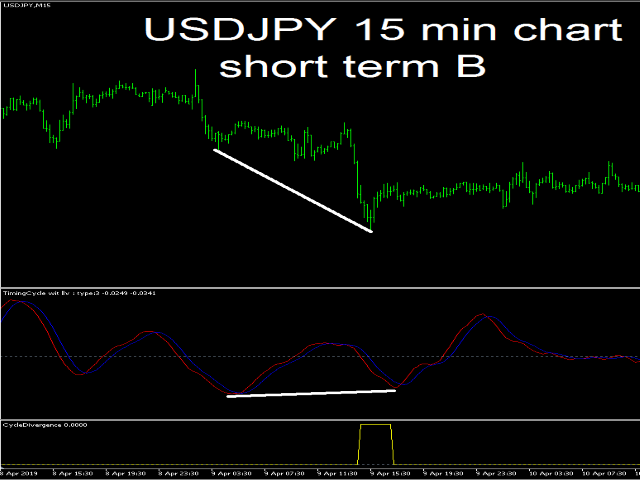
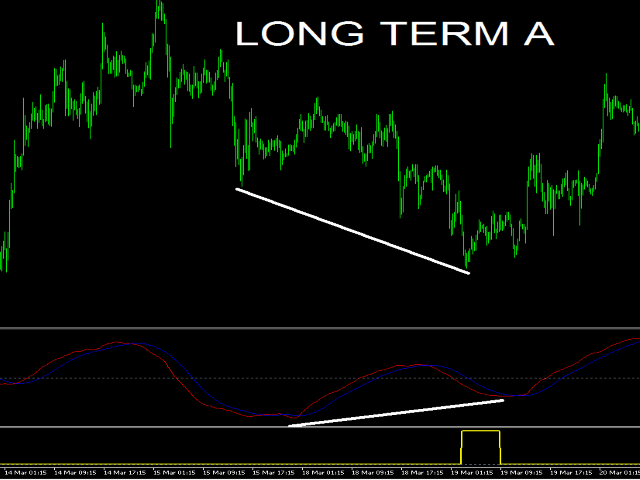
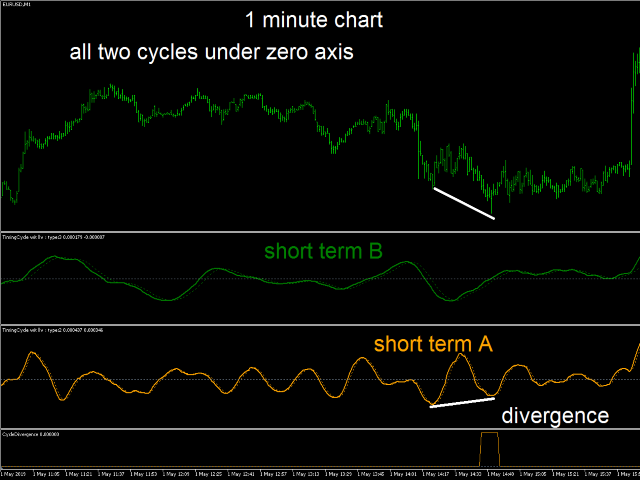
As for the cycle discussion, I invite you to read the TimingCycleWithLLV indicator presentation ...please ask me if something is not clear.I think tha time is much more important than price;this is the reason for wich I trade only when one cycle finishes and the new one start. In order to use the CycleDivergence indicator follow these steps: 1) for example (see imagine number four) 1 minute chart,in the first window you put TimingCycleWithLLV short term B green 2) in the second window you put TimingCycleWithLLV short term A yellow in practice short term A is half duration of short termB 3) for trading: A) looks when ALL two cycles are under zero axis or B) looks for divergences of short term A when low sinusoid under zero axis is greater than the previous low and price is lower than previos low and short termB is below zero axis.
For scalping on 1 minute chart look at divergence on :very short term,short term A/BFor scalping of cycle of some hours look for medium term A/BVery impressive are divergences on 5/15 minute chart with all settingsOn 1hour chart you see cycle divergence lasting some days till weekly and monthly cycles.
Deliberately I did not put the input sets for the cycles, this is the secret I discovered in many years of study.