MACD Indicator with Histogram
- Indicatori
-
Cao Minh Quang
 Welcome to my profile. I am a developer MQL4 and MQL5.
Telegram: https://t.me/storevan
Thanks and regards! - Versione: 1.7
- Aggiornato: 26 settembre 2025
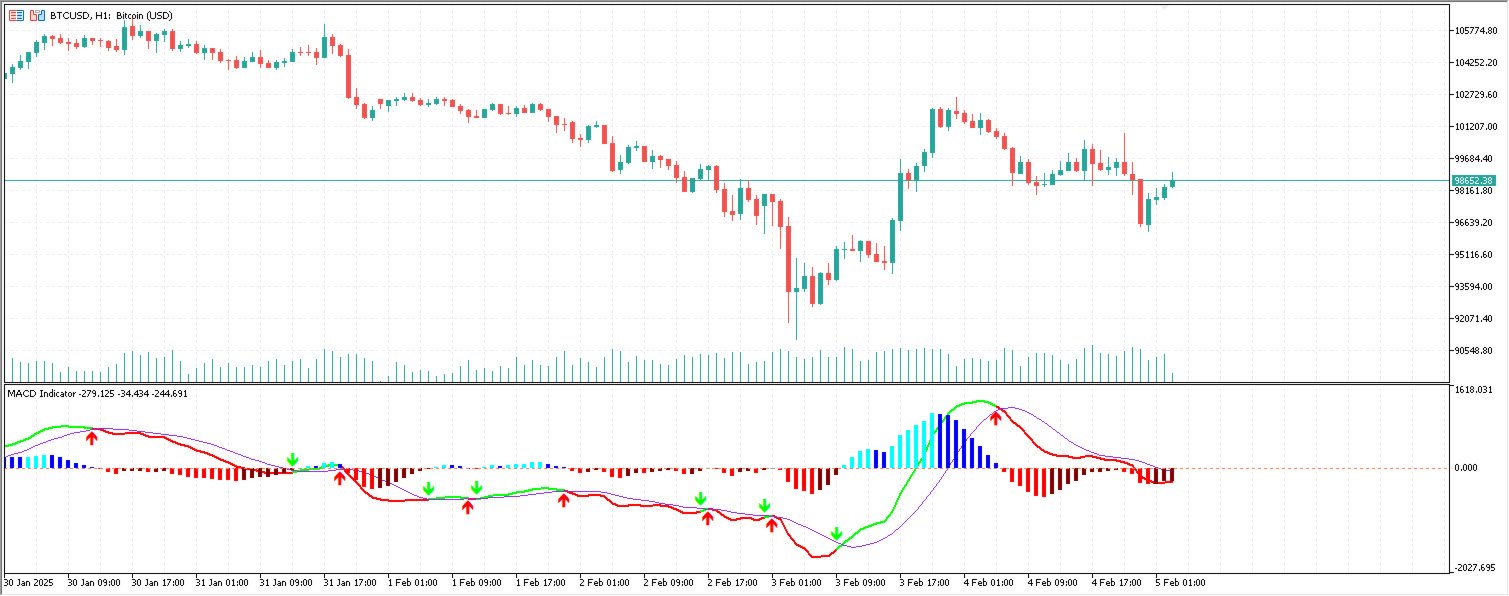
MACD Indicator
It has MACD line, Signal line, and Histogram.
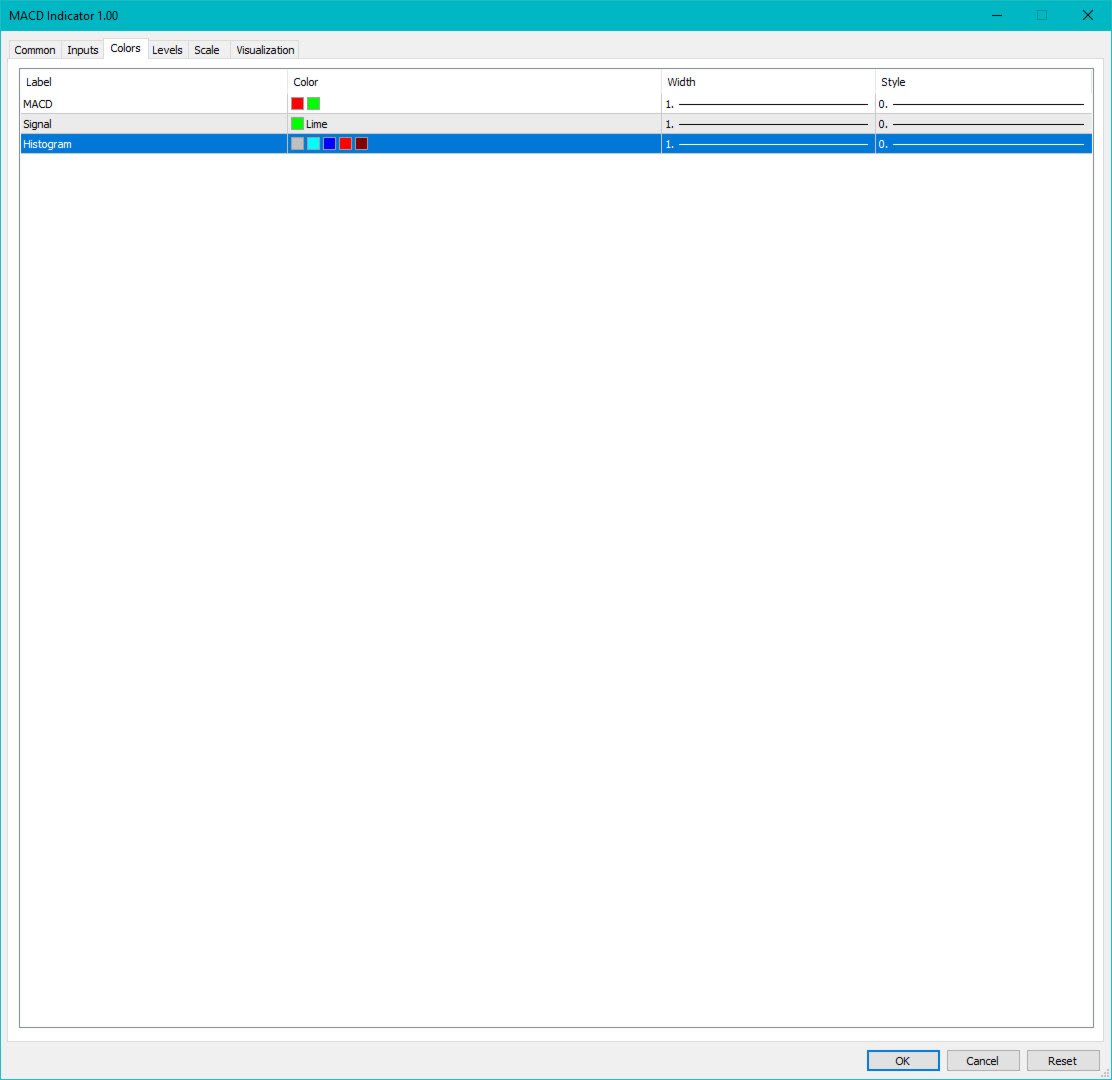
The Histogram has 4 colors based on Direction Above and Below the Zero Line, showing its movement direction as simple as possible.
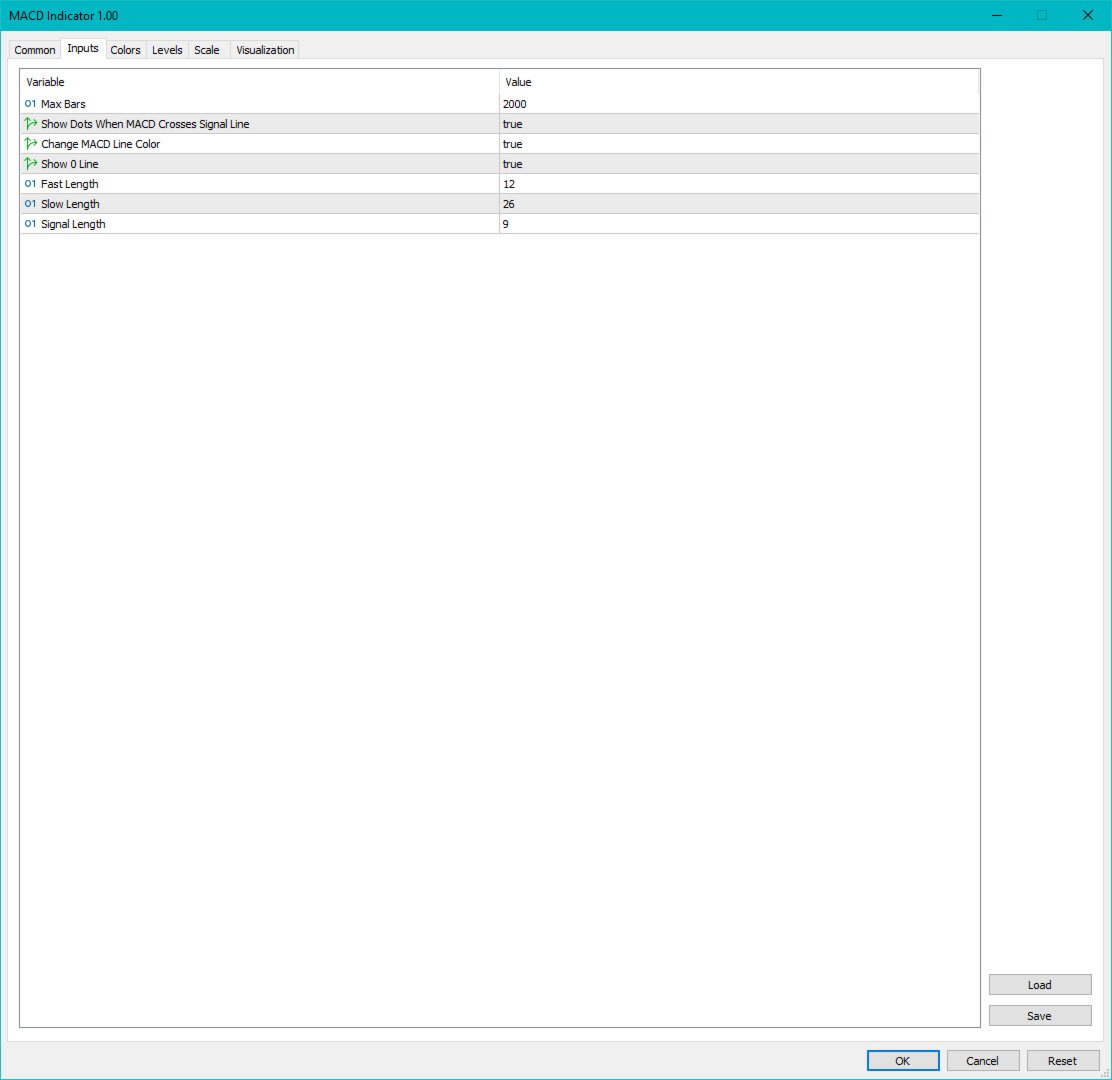
Allows Show MACD & Signal Line, Show Change In color of MACD Line based on cross of Signal Line.
Show Dots at Cross of MacD and Signal Line, Turn on and off Histogram.
Enjoy your trading experience, and feel free to share your comments and reviews.
If you are interested in this indicator, you might be interested in the more advanced indicators that I provide:
For MT5:
Fair Value Gaps with Order Block Detector
For MT4:
Fair Value Gaps with Order Block Detector


Thanks!