Quantum Dynamic POC Hi Tf

Quantum Dynamic POC Hi Tf for MT5

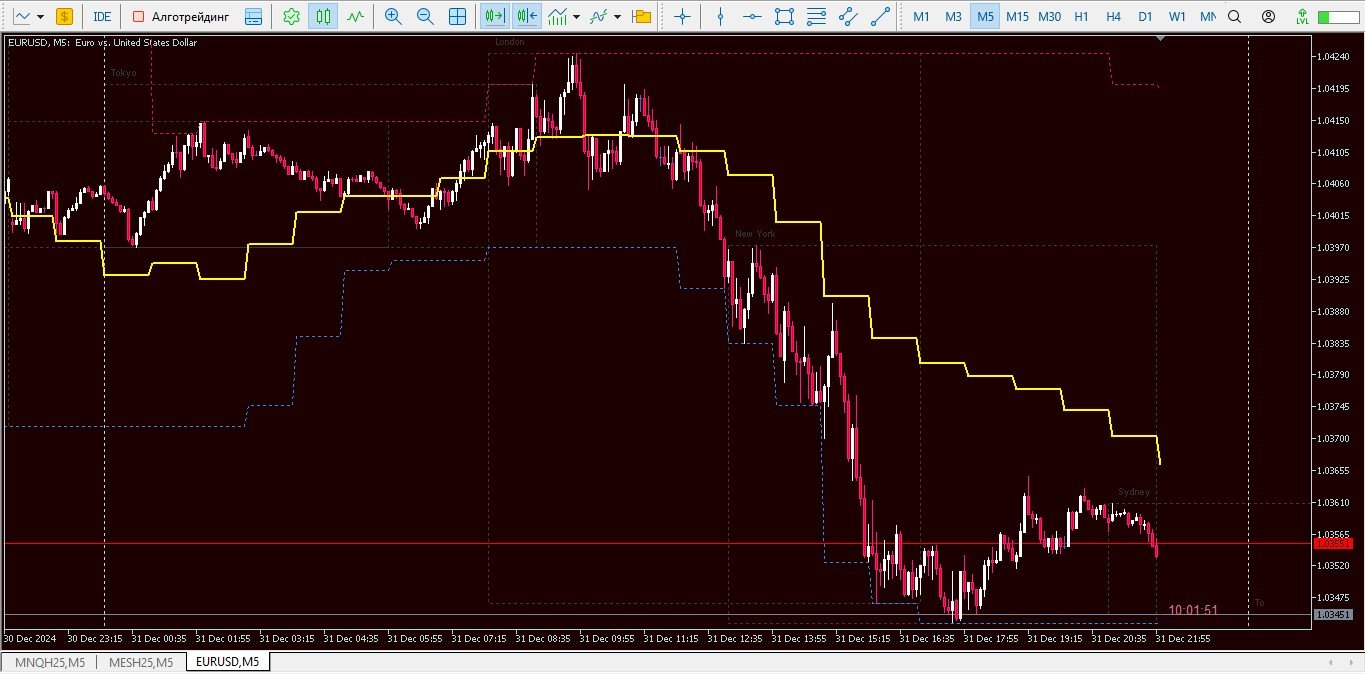
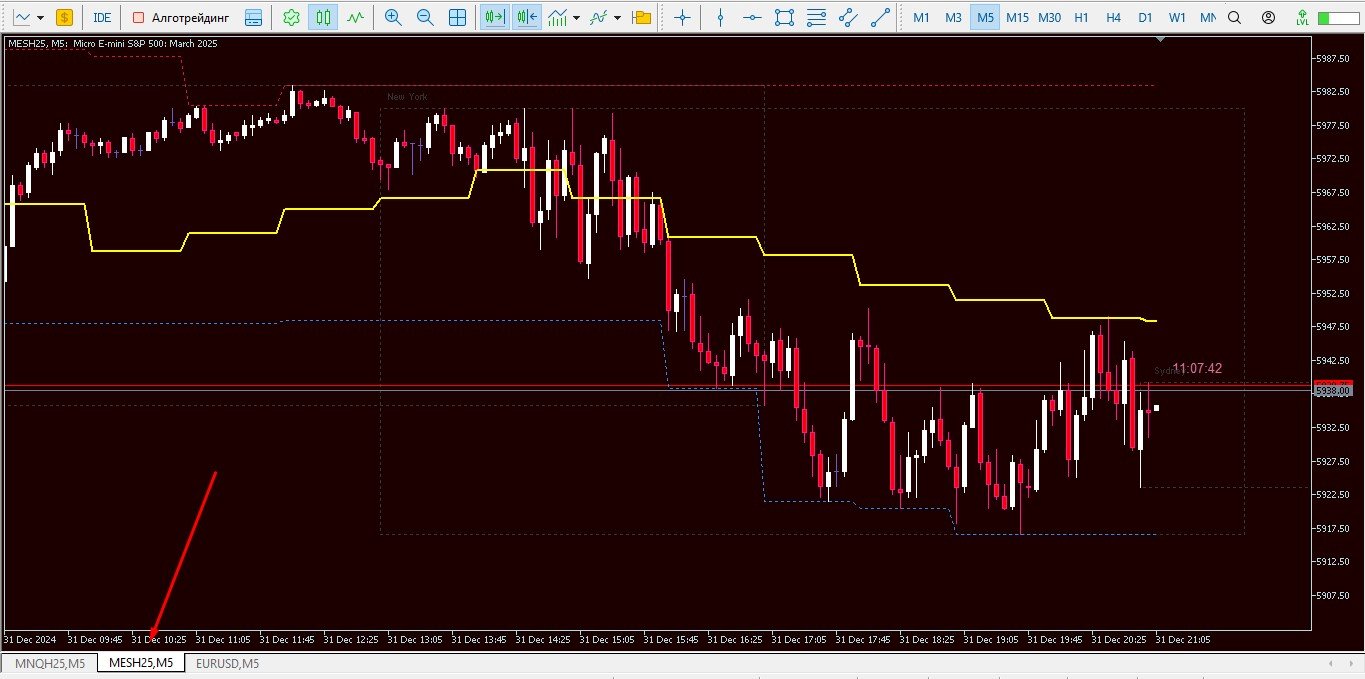
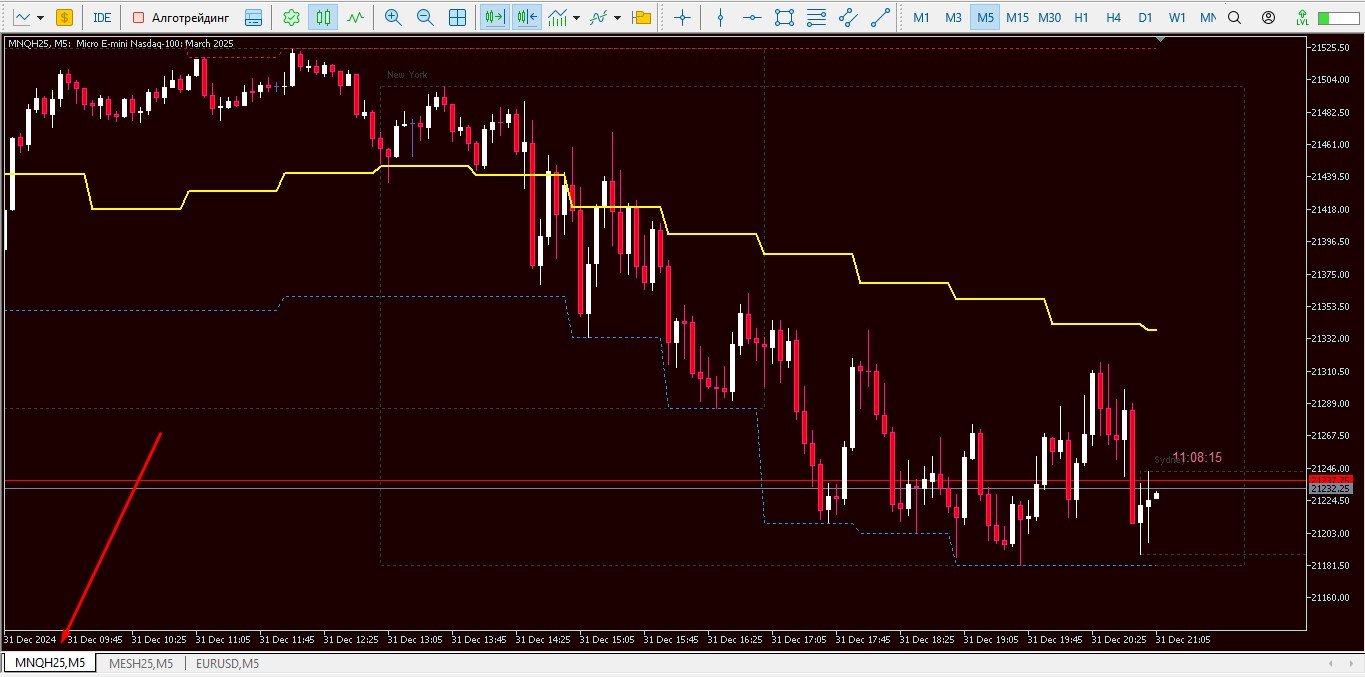
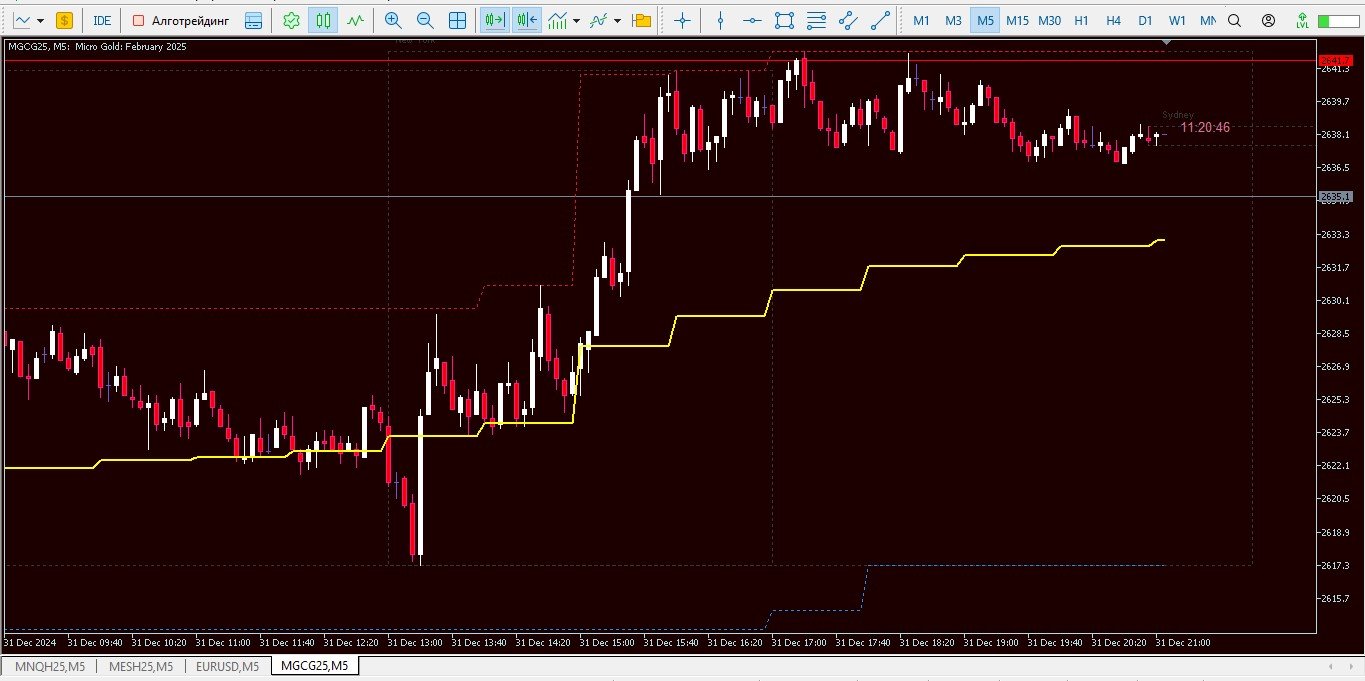
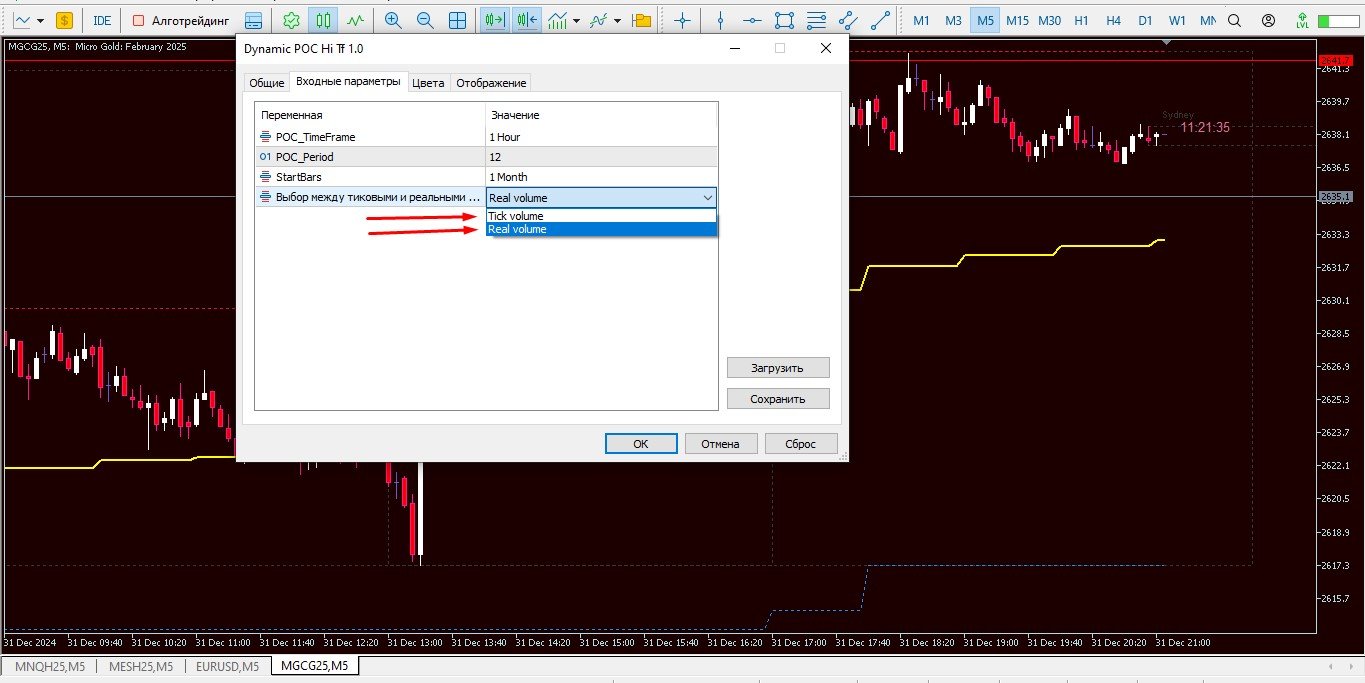
Description: The "Quantum Dynamic POC Hi Tf" is a unique indicator developed for volume analysis. It is suitable for both real volumes (on futures contracts) and tick volumes (on the Forex market). The indicator is a channel tool consisting of three lines that dynamically change depending on the selected timeframe:

  • Middle Line: the main dynamic Point of Control (POC), which reflects the average volume price.

  • Upper Line: the maximum of the selected timeframe.

  • Lower Line: the minimum of the selected timeframe.

Key Features and Benefits:

  • Dynamic Display: The indicator automatically adapts to changing market conditions, providing up-to-date data for making trading decisions.

  • Flexible Settings: The user can choose any higher timeframe for calculating the dynamic average volume price, as well as the bar period and calculation start (day, week, month).

  • Visual Clarity: Color schemes and graphical elements ensure ease of perception and data analysis.

Entry Conditions:

  • POC Breakout:

    • If the price breaks through the POC from below, open buy positions.

    • If the price breaks through the POC from above, open sell positions.

  • Stop-Loss:

    • Set the stop-loss above/below the POC line or below the nearest high/low of the current timeframe.

  • Take-Profit:

    • Set the take-profit on the upper/lower lines of the indicator.

    • Partially close positions at these levels to reduce risks.

Recommended Settings:

  • By default, the indicator is set to the M5 chart with calculations based on the H1 higher timeframe.

  • For trading on the M15 chart, it is recommended to set the higher timeframe to H4 or D1 for the most accurate and useful data.

Advantages of Using "Quantum Dynamic POC Hi Tf":

  • Improved Trading Results: The indicator helps to determine key support and resistance levels, allowing for more informed trading decisions.

  • Risk Reduction: Accurate signals for opening and closing positions help to minimize risks and increase profits.

  • Ease of Use: Simple and intuitive settings make the indicator accessible to traders of any level.


추천 제품
Symbol Cost Info
Opeyemi Fuad Anokwu
Introducing the “Symbol Cost Info MT5” indicator – your ultimate tool for staying ahead in the forex market! This innovative indicator is designed to empower traders with real-time cost information, directly on their charts. Here’s why every trader needs the “Symbol Cost Info MT5” in their arsenal: Real-Time Spread Monitoring : Keep a close eye on the spread for any currency pair, ensuring you enter the market at the most cost-effective times. Pip Value at Your Fingertips : Instantly know the v
FREE
Breakeven line calculator
Wafa Mohammed Omar Abou Alwafa
5 (2)
This indicator shows the breakeven line level for the total number of open positions of the current symbol with P/L value and total volume. This indicator is helpful to decide the exit level when using a trading grid strategy. The style of the breakeven line is customizable to choose the color, line shape and font size of the positions description. Send mobile notification when crossing a positive P/L target
FREE
Real-Time Spread Display Tool A   real-time spread display tool   is a specialized software or application designed to provide traders and investors with instant, live data on the   spread —the difference between the bid price (the price at which buyers are willing to purchase an asset) and the ask price (the price at which sellers are willing to sell it)—for various financial instruments. This tool is critical in markets such as forex (FX), stocks, futures, and cryptocurrencies, where price f
Trade Condition Logger MT5
AbelPM Enterprises Pty Ltd
The   Trade   Condition   Logger   is   an   essential   tool,   offering   crucial   insights   into: Current   swap   and   spread   values Automatic   logging   of   fluctuations   in   swap   values Logging spread   value   range over   time Optimise   spread   values for specific instrument Displays   a   comprehensive   summary   on   the   chart,   providing   traders   with   insights   into   trade   conditions.  Review trade conditions for your various   broker   accounts   enabling  
Trending Purpose Pro
G C Hency Shameela
he "Trending Purpose Pro" is easy to use, even for traders with limited programming knowledge.  It provides a straightforward representation of the high prices on the chart, allowing traders to quickly identify the highs of each candlestick.Customizable Appearance:  The appearance can be easily customized to suit individual preferences. Traders can adjust the color, line style, and width of the high price line according to their charting preferences.Real-Time Data: The "Trending Purpose Pro" ca
Clear Candle Countdown for Every Chart Knowing the exact time left until the current candle closes helps in making timely trading decisions. Candle Timer Essential MT5 offers a visible countdown for all available MT5 timeframes directly on your chart. This tool is reliable, efficient, and easy to configure. Features Real-time candle countdown for all standard MT5 timeframes Customizable color scheme for header, timer, and description Auto-adaptive layout for optimal visibility on any chart Effic
Justo mini indice
Pedro Augusto Escoque Marin
Este indicador calcula e exibe no gráfico o preço justo do mini índice (WIN) com base em dados fundamentais do mercado. Além disso, ele traça automaticamente linhas de suporte e resistência percentuais , ajudando você a visualizar zonas importantes de preço. É como ter uma régua financeira no gráfico, mostrando onde o preço "deveria estar", de forma objetiva, considerando o cenário macroeconômico! O indicador usa uma fórmula de precificação de contratos futuros baseada em: O preço à vista do Ib
RSI Pro Basic
VALU VENTURES LTD
The ONLY RSI Indicator You'll Ever Need - Works with ANY Broker, ANY Symbol! Finally, an RSI indicator that automatically adapts to YOUR broker's symbol naming conventions!   Whether you trade Forex, Gold, Bitcoin, or Stock Indices - this universal indicator detects and monitors related symbols automatically. KEY FEATURES & BENEFITS UNIVERSAL COMPATIBILITY Auto-Detects Broker Patterns : Works with ANY broker suffix (.m, .pro, .raw, etc.) All Asset Classes : Forex, Metals (Gold/Silver), Crypto,
FREE
Trade Performance Information
Andres Mauricio Serrano Quintero
This indicator will help you track performance of your trades, even scalping trades.  You can use it with the Arab, and many other traders.  This indicator displays essential trading account information directly on your chart. It positions itself in one of the four corners of the screen and showcases details such as: Symbol: The symbol of the asset currently displayed on the chart. Profit/Loss: The total profit or loss in dollars for the current symbol. Pips: The total number of pips gained or
FREE
Powerful trend indicator provided with all necessary for trade and it is very easy to use. Everyone has probably come across indicators or Expert Advisors that contain numerous input parameters that are difficult to understand. But here, input parameters are simple and it is no need to configure anything — neural network will do all for you. Difference from a classic version The real-time multi time frame panel is added, so you can check a trend for other timeframes without switching the schedu
MultiSession Volume Profile is a professional volume profile indicator for MetaTrader 5 that builds separate POC, VAH, VAL and volume histograms for multiple custom trading sessions on the same chart. It helps you see where volume truly concentrated in each part of the day (RTH, Globex, Asia, London, etc.), so you can identify key intraday levels, ranges, and magnets that many standard tools miss. ​ Main advantages Multi-session profiles Build up to 5 fully independent sessions with custom times
WAPV Box Effort x Result
Eduardo Da Costa Custodio Santos
MT5에 대한 WA_PV_BOX_EFFORT X 결과 WAPV 상자 노력 x 결과 표시기는 패키지 표시기 그룹(Wyckoff Academy Wave Market)의 일부입니다. MT5용 WAPV Box Effort x Result Indicator는 가격과 거래량을 읽는 데 도움이 됩니다. 그 판독은 노력 x 결과의 식별을 돕는 것으로 구성됩니다. 그래프에 의해 생성된 파동. 상자가 녹색일 때 MT5에 대한 WAPV 상자 노력 x 결과 표시기는 거래량이 수요에 유리하고 상자가 빨간색일 때를 의미합니다. 물량은 공급에 유리하다. 상자가 클수록 가격에 대한 부피의 변위가 커집니다. 가격의 상승파동이 Box의 크기에 비례하지 않는다면, 노력 x 결과. 매우 시각적인 방법으로 우리는 볼륨과 가격 사이의 이러한 차이를 식별할 수 있습니다. MT5용 WAPV Box 노력 x 결과 표시기를 사용하면 표시기를 0축 아래에 배치하여 시각화를 개선할 수도 있습니다. 틱 볼륨 및 실제 볼륨으로 시장에서
Smart Fair Value Gap Pro
Joao Luiz Savioli Filho
Unlock the power of Smart Money Concepts (SMC) with the cleanest FVG indicator on the market. Smart FVG Pro is not just another gap detector. It is designed for professional traders who need to filter out noise and focus on high-probability reversal zones. Unlike standard indicators that clutter your chart with every minor gap, Smart FVG Pro uses advanced filtering logic (Trend + Volatility) and a unique "Smart Mitigation" system to automatically remove invalidated zones, keeping your chart clea
Sessions Premium
Edson Javier Jaramillo Diaz
1 (1)
Session Boxes - Advanced Market Sessions Visualization Indicator Overview The Session Boxes indicator is a powerful and highly customizable tool designed to help traders visualize major trading sessions directly on their charts. By clearly displaying the Asian, London, New York, Sydney, and Frankfurt sessions, traders can easily identify optimal trading times and potential market volatility periods. Key Features Multiple Session Support - Asian Session (Default: 00:00-09:00) - London Session
Buy Sell Multiple Panel - Execute Bulk Orders in a Single Click! Description: Save time and seize market opportunities instantly. This powerful panel allows you to place multiple buy or sell orders simultaneously, each with custom lot sizes, take-profit, and stop-loss levels. Perfect for sophisticated entry strategies and managing complex trades efficiently. Key Features: Bulk Order Execution: Open multiple market orders at once with just one click. Flexible Lot Sizing: Set individual lot size
RQL Trend Board – Description RQL Trend Board is a simple but powerful multi-timeframe trend dashboard. It shows the current market bias across several timeframes at the same time, using an internal trend-classification method. Each timeframe is displayed as a colored box: Green – bullish bias → look for long setups Yellow – ranging / unclear → no trade zone Red – bearish bias → look for short setups The indicator gives a clear overall picture of where the market wants to go, instead o
FREE
Live Price With PNL
Muhammad Jawad Shabir
실시간 가격 및 총 수익 표시 지표 라이브 트레이딩 및 화면 공유에 완벽 데이 트레이더, 스캘퍼 및 라이브 스트림 트레이딩 세션을 위해 특별히 설계됨 이 전문 지표는 차트에서 직접 실시간 가격 표시와 포괄적인 수익 추적을 제공합니다 - 고빈도 거래 및 라이브 트레이딩 방송에 필수적입니다. 주요 기능 실시간 가격 표시 매초 라이브 매수 가격 업데이트 모든 심볼 유형에 대한 전문적 형식화 귀금속을 위한 특별 골드/XAU 형식화 화면 공유에 완벽한 대형 명확한 표시 데이 트레이딩 결정을 위한 즉시 가격 업데이트 포괄적 수익 추적 트레이딩 히스토리로부터의 계좌 총 수익 거래 종료 시 실시간 수익 업데이트 사용자 정의 추가 수익 금액 수수료 및 스왑 포함 플러스/마이너스 지표가 있는 전문적 수익 형식화 성능 최적화 스마트 캐싱 시스템 - 최소 CPU 사용 1초 업데이트 간격 - 번개처럼 빠름 효율적인 타이머 기반 업데이트 실시간 거래 모니터링 전문적 오류 처리 고급 사용자 정의 조정 가능한
FREE
Wolf Countdown
Tiziano Zambelli Sopalu
Wolf Countdown helps you not to waste the right amount of time, it gives you back the time remaining until the candle closes. How to use: Download and install the  Wolf Countdown Indicator on your MetaTrader 5. Apply the indicator to your favorite chart. this works on any timeframe... Thanks to this indicator you will never miss the right moment to enter your trades.
FREE
Distance Average Bands
Luis Paulo Rodrigues Pastor
A very assertive and easy-to-view indicator, which can be used in any financial asset. This indicator aims to show moments when the average price deviation in relation to the average deviation exceeds the configured standard deviation. Step 1: We measure the distance between the price and the average configured in the "MAPrice" parameter; Step 2: We calculate the average "MADistancePeriod" of the distances measured in Step 1. Step 3: We calculate the standard deviation "Deviation" from th
Telegram to mt5 signal copier
Chukwuemeka Kingsley Anyanwu
5 (1)
Copies Signal from any Telegram channel and instantly executes the trade on MT5 without admin rights! Do you receive trading signals on Telegram and wish they could execute instantly on Meta Trader 5? READ THIS FOR SETUP GUIDE Telegram to MT5 Signal Copier is a powerful bridge between your Telegram signal channels and MetaTrader 5. It listens to messages from a specific Telegram channel and automatically extracts trading signals — including symbol, action, entry price, stop loss, and take prof
Gamma Volatility Levels
Carlos Pascual Perez Maturano
Gamma & Volatility Levels Pro [XAUUSD Edition] – The indicator used by professional gold traders in 2025 Fully automatic indicator developed exclusively for XAUUSD (Gold). Displays in real time the most powerful institutional levels that move gold price every single day: • HVL (High Volatility Level) – Orange dashed line Dynamic extreme volatility level (20-period SMA + 1 standard deviation). Gold bounces or breaks this level 87 % of sessions with moves of +$40 to +$120. • CALL RESISTANCE – Blue
Summary Risk Target
Kholil Lurrohman
The “Summary Risk Target” indicator is designed to show the total number of transactions made on a single pair. The transactions counted include active positions as well as pending orders . By setting a stop loss for each trade, this indicator displays the total potential risk (loss) that may be incurred. This helps traders easily understand their overall risk exposure without the need for manual calculations. Likewise, for take profit , if the TP level is defined—either in terms of pips or at a
FREE
1. Overview Thank you for choosing the SuperTrend Suite for MT5. This package provides a set of powerful tools for trend analysis, designed to integrate seamlessly into your MetaTrader 5 platform. This suite includes two components: SuperTrend Indicator : A robust trend-following indicator that displays the current market trend directly on your chart, complete with entry signals and alerts. SuperTrend Screener EA : A multi-symbol dashboard that scans a user-defined list of instruments in the bac
FREE
DESCRIÇÃO O indicador   EasyFollowerTrader-Bot2-DayTrade   opera apenas a favor da tendência. Assim, o indicador, em primeiro momento, observar a tendência de três médias síncrona com o time-frame selecionado. Em seguida, o indicador observar a tendência do gráfico diário. Quando estes dois gráficos estiverem se movimentando na mesma direção, teremos a maior probabilidade de ganhos. Chamaremos esta região como região de alta probabilidade de ganho. Na região de alta probabilidade de ganho, o ind
Airplanes Trends
Andriy Sydoruk
Airplane   Trend   entry points should be used as potential market reversal points. The indicator works using the cyclic-wave dependence function. Thus, all entry points will be optimal points where the movement changes. The simplest way to use the indicator is to open a trade in the direction of an existing trend. The best result is obtained by combining the indicator with fundamental news, it can act as a news filter, that is, it can show how the market reacts to this or that news. The defa
You can see Binance Spot data instantly in Metatrader 5 and it allows you to use all the features that Metatrader has provided to you. You can access the data of all symbols listed on Binance Futures. Don't forget to set the timezone. Binance it's 00:00 UTC. You need to fix it according to your own country You need to install the free Binance Spot Symbol List plugin. https://www.mql5.com/tr/market/product/83507 After loading, it automatically downloads the data of the cryptos in the market obser
Forex Relative Performance indicator This indicator calculates the relative strength of major currencies against the US dollar. The basic idea behind this indicator is "to buy strong currency and to sell weak currency". This indicator allows you to quickly identify the best forex pair to trade according to your trading style (Intraday, Scalping, Swing, or Long Term)
Price Spectrum
Yuriy Ponyatov
The Price Spectrum indicator reveals opportunities for detailed market analysis. Advantages: Market Volume Profile Creation : The indicator assists in analyzing the dynamics of trading volumes in the market. This allows traders to identify crucial support and resistance levels, as well as determine market structure. Filtering Insignificant Volumes : Using the indicator helps filter out insignificant volumes, enabling traders to focus on more significant market movements. Flexible Configuration S
Pendiente de Precio
Cesar Juan Flores Navarro
Indicador en base a la pendiente de la linea de precio, dibuja una línea de color cuando sube a base de los precios que previamente has sido procesados o linealizados, y cuando baja la pendiente la linea linealizada toma otro color. En este caso se a considerado 6 lineas de diferentes procesos desde pendientes largas hacia las cortas, observándose que cuando coincidan las pendientes se produce un máximo o mínimo, lo que a simple vista nos permitirá hacer una COMPRA O VENTA.
A professional tool for real-time monitoring of the account status and the work of Expert Advisors. Information about the account status can be sent to Telegram chats automatically at a specified interval or upon request. From the screenshots of the open charts of the terminal, you receive upon request from your Telegram bot. Account information includes: 13:02 Trade monitoring by Telegram v.1.0 (headline) Account : 6802ххх RoboForex-Pro (account information) Profit start: 2661 USD (profit earne
이 제품의 구매자들이 또한 구매함
ARICoins
Temirlan Kdyrkhan
ARICoin is a powerful trading companion designed to generate high-probability entry signals with dynamic TP/SL/DP levels based on volatility. Built-in performance tracking shows win/loss stats, PP1/PP2 hits, and success rates all updated live. Key Features: Buy/Sell signals with adaptive volatility bands Real-time TP/SL/DP levels based on ATR Built-in MA Filter with optional ATR/StdDev volatility Performance stats panel (Success, Profit/Loss, PP1/PP2) Alerts via popup, sound, push, or email Cust
AriX
Temirlan Kdyrkhan
1 (4)
AriX Indicator for MT5 A powerful trend-following and signal-evaluation tool AriX is a custom MT5 indicator that combines Moving Averages and ATR-based risk/reward logic to generate clear buy/sell signals. It visualizes dynamic SL/TP levels, evaluates past trade outcomes, and displays win/loss statistics in a clean on-chart panel. Key features include: Buy/Sell signals based on MA crossovers ATR-based SL/TP1/TP2/TP3 levels with visual lines and labels Signal outcome tracking with real-time stat
ARIScalping
Temirlan Kdyrkhan
ARIScalp is a powerful trading companion designed to generate high-probability entry signals with dynamic TP/SL/DP levels based on volatility. Built-in performance tracking shows win/loss stats, PP1/PP2 hits, and success rates all updated live. Key Features: Buy/Sell signals with adaptive volatility bands Real-time TP/SL/DP levels based on ATR Built-in MA Filter with optional ATR/StdDev volatility Performance stats panel (Success, Profit/Loss, PP1/PP2) Alerts via popup, sound, push, or email Cus
Azimuth Pro
Ottaviano De Cicco
5 (1)
LAUNCH PROMO Azimuth Pro price is initially set at 299$ for the first 100 buyers. Final price will be 499$ . THE DIFFERENCE BETWEEN RETAIL AND INSTITUTIONAL ENTRIES ISN'T THE INDICATOR — IT'S THE LOCATION. Most traders enter at arbitrary price levels, chasing momentum or reacting to lagging signals. Institutions wait for price to reach structured levels where supply and demand actually shift. Azimuth Pro maps these levels automatically: swing-anchored VWAP, multi-timeframe structure lines, an
Weis Wave with Alert MT5
Trade The Volume Waves Single Member P.C.
4.94 (17)
Rental/Lifetime Package Options and Privileges  Rent Monthly Six Months   Yearly/Lifetime Weis Wave with Speed with Alert+Speed Index x x x Manual  x x x Quick Set up Video x x x Blog x x x Lifetime Updates x x x Setup and Training Material x x Discord Access Channel "The SI traders"          x Rectangle Break Alert Tool      x How to trade with it:    http://www.tradethevolumewaves.com   ** If you purchase please contact me to setup your  : Training Room and  complete manual access.  Wei
우선적으로, 이 거래 도구는 전문적인 거래에 이상적인 비-다시 그리기 및 지연되지 않는 지표입니다.  온라인 강좌, 사용자 매뉴얼 및 데모. 스마트 가격 액션 컨셉트 인디케이터는 신규 및 경험 많은 트레이더 모두에게 매우 강력한 도구입니다. Inner Circle Trader Analysis 및 Smart Money Concepts Trading Strategies와 같은 고급 거래 아이디어를 결합하여 20가지 이상의 유용한 지표를 하나로 결합합니다. 이 인디케이터는 스마트 머니 컨셉트에 중점을 두어 대형 기관의 거래 방식을 제공하고 이동을 예측하는 데 도움을 줍니다.  특히 유동성 분석에 뛰어나 기관이 어떻게 거래하는지 이해하는 데 도움을 줍니다. 시장 트렌드를 예측하고 가격 변동을 신중하게 분석하는 데 탁월합니다. 귀하의 거래를 기관 전략에 맞추어 시장의 동향에 대해 더 정확한 예측을 할 수 있습니다. 이 인디케이터는 시장 구조를 분석하고 중요한 주문 블록을 식별하고 다양
MetaForecast M5
Vahidreza Heidar Gholami
5 (3)
MetaForecast는 가격 데이터의 조화를 기반으로 모든 시장의 미래를 예측하고 시각화합니다. 시장이 항상 예측 가능한 것은 아니지만 가격에 패턴이 있다면 MetaForecast는 가능한 정확하게 미래를 예측할 수 있습니다. 다른 유사한 제품과 비교했을 때, MetaForecast는 시장 동향을 분석하여 더 정확한 결과를 생성할 수 있습니다. 입력 매개변수 Past size (과거 크기) MetaForecast가 미래 예측을 생성하기 위한 모델을 만드는 데 사용하는 막대의 수를 지정합니다. 모델은 선택한 막대 위에 그려진 노란색 선으로 표시됩니다. Future size (미래 크기) 예측해야 할 미래 막대의 수를 지정합니다. 예측된 미래는 핑크색 선으로 표시되며 그 위에 파란색 회귀선이 그려집니다. Degree (차수) 이 입력은 MetaForecast가 시장에서 수행할 분석 수준을 결정합니다. Degree 설명  0 차수 0의 경우, "Past size" 입력에 모든 봉우리와
ARIPoint
Temirlan Kdyrkhan
1 (1)
ARIPoint is a powerful trading companion designed to generate high-probability entry signals with dynamic TP/SL/DP levels based on volatility. Built-in performance tracking shows win/loss stats, PP1/PP2 hits, and success rates all updated live. Key Features: Buy/Sell signals with adaptive volatility bands Real-time TP/SL/DP levels based on ATR Built-in MA Filter with optional ATR/StdDev volatility Performance stats panel (Success, Profit/Loss, PP1/PP2) Alerts via popup, sound, push, or email Cu
RelicusRoad Pro MT5
Relicus LLC
5 (24)
훌륭한 백테스트, 환상적인 숫자로 입증된 실제 계정 성능, 그리고 모든 곳에 퍼져 있는 통계를 자랑하는 트레이딩 지표를 얼마나 자주 구매하셨습니까? 하지만 사용 후에는 결국 계좌를 날려버리셨나요? 신호 자체만으로는 신뢰할 수 없습니다. 신호가 왜 처음 나타났는지 알아야 하며, 그것이 바로 RelicusRoad Pro가 가장 잘하는 일입니다! 사용자 매뉴얼 + 전략 + 교육 비디오 + VIP 액세스 전용 그룹 + 모바일 버전 사용 가능 시장을 보는 새로운 방법 RelicusRoad는 외환, 선물, 암호화폐, 주식 및 지수를 위한 세계에서 가장 강력하고 최고의 트레이딩 지표 로서, 트레이더가 계좌를 성장시키는 데 필요한 모든 정보와 도구를 제공합니다. 우리는 기술 분석 및 트레이딩 계획 을 제공하여 초보자 부터 고급 트레이더 까지 모든 트레이더가 성공할 수 있도록 돕습니다. 이것은 미래 시장을 예측 하는 데 충분한 정보를 제공하는 핵심 트레이딩 지표 입니다. 우리는 차트에서 의미 없
Max Ribbon Mt5
Stefano Frisetti
WARNING: This indicator is distributed EXCLUSIVELY on MQL5.com MT4 version:   https://www.mql5.com/it/market/product/160363 MT5 version:   https://www.mql5.com/it/market/product/160410 ============================================================================================= MAX RIBBON ver 1.00 The indicator that shows you the TREND clearly and unambiguously! ============================================================================================= DESCRIPTION MAX RIBBON is an advanced tre
SynaptixQuant Dominance Matrix
Devie Arevalo Montemayor
5 (1)
SynaptixQuant Dominance Matrix: Institutional-Grade Market State Extraction Engineered for traders who require a data-driven view of market behaviour beyond surface-level indicators. The Synaptix Quant (SQ) Dominance Matrix is not a conventional currency strength display. Behind its intentionally streamlined interface runs a sophisticated analytical architecture designed to quantify market conditions with precision. Every output is generated through layered signal processing built to identify d
FootprintOrderflow
Jingfeng Luo
5 (3)
FOOTPRINTORDERFLOW: The Authoritative Guide ( This indicator is also compatible with economic providers that do not offer DOM data and BID/ASK data, It also supports various foreign exchange transactions ) 1. Overview FOOTPRINTORDERFLOW  is an advanced Order Flow analysis tool designed for MetaTrader 5 (MT5). Unlike traditional candlestick charts that only show OHLC (Open, High, Low, Close), this indicator parses real-time Tick data to visualize the microstructure inside every candle. It helps y
+++++++++++++++++++++++++++++++++++++++++++++++++++++++++++++++++++++++++++++++++++++++++++++++++ +++ Link to EURUSD Only Free Version -->  https://www.mql5.com/en/market/product/156904?source=Unknown +++++++++++++++++++++++++++++++++++++++++++++++++++++++++++++++++++++++++++++++++++++++++++++++++ Hallo Trader, This is a traditional GANN & FIBONACCI strategy based on detection of an impulsive move in the opposite direction. This is called a Breakout. At the moment of Breakout, the indicator draw
Hyperbolic
Konstantin Gruzdev
The indicator is stable on noise fluctuations in price and quickly reacts to the trend. It is based on an algorithm from a system of hyperbolic functions that allows you to aggressively smooth the flat with minimal lag on the trend. It can be applied directly to the price chart, to itself, or to other indicators in order to eliminate false signals. The main purpose of the indicator is to smooth out small sawtooth price movements as much as possible. The higher the Hyperbolic parameter, the stron
Prices move for many reasons and these can vary from one operator to another: software, private and institutional traders simultaneously contribute to the formation of the price, making predictive art very difficult. However, there are measurable factors that bind the price to an underlying trend in line with the physical reality that the financial asset represents: these are the macroeconomic indicators. Large investors use this information wisely to set their strategies. Understanding these m
Matreshka
Dimitr Trifonov
5 (2)
Matreshka self-testing and self-optimizing indicator: 1. Is an interpretation of the Elliott Wave Analysis Theory. 2. Based on the principle of the indicator type ZigZag, and the waves are based on the principle of interpretation of the theory of DeMark. 3. Filters waves in length and height. 4. Draws up to six levels of ZigZag at the same time, tracking waves of different orders. 5. Marks Pulsed and Recoil Waves. 6. Draws arrows to open positions 7. Draws three channels. 8. Notes support and re
Elliott Wave Trend MT5
Young Ho Seo
4 (4)
Elliott Wave Trend was designed for the scientific wave counting. This tool focuses to get rid of the vagueness of the classic Elliott Wave Counting using the guideline from the template and pattern approach. In doing so, firstly Elliott Wave Trend offers the template for your wave counting. Secondly, it offers Wave Structural Score to assist to identify accurate wave formation. It offers both impulse wave Structural Score and corrective wave Structure Score. Structural Score is the rating to sh
Stop calculating lot sizes manually. Stop guessing your Risk/Reward ratio. The Risk Reward Tool brings the intuitive, visual trading style of TradingView directly to your MetaTrader 5 charts. It is designed for traders who value speed, precision, and visual clarity. Whether you trade Forex, Indices (DAX, US30), or Commodities (Gold, Oil), this tool handles the math for you. Simply click "Long" or "Short," drag the lines to your levels, and the tool instantly tells you exactly how many lots to t
TrendMaestro5
Stefano Frisetti
note: this indicator is for METATRADER4, if you want the version for METATRADER5 this is the link:  https://www.mql5.com/it/market/product/108106 TRENDMAESTRO ver 2.5 TRENDMAESTRO recognizes a new TREND from the start, he never makes mistakes. The certainty of identifying a new TREND is priceless. DESCRIPTION TRENDMAESTRO identifies a new TREND in the bud, this indicator examines the volatility, volumes and momentum to identify the moment in which there is an explosion of one or more of these da
Step into the world of Forex trading with confidence, clarity, and precision using Gold Indicator a next-generation tool engineered to take your trading performance to the next level. Whether you’re a seasoned professional or just beginning your journey in the currency markets, Gold Indicator equips you with powerful insights and help you trade smarter, not harder. Built on the proven synergy of three advanced indicators, Gold Indicator focuses exclusively on medium and long-term trends elimina
무료 AUX 인디케이터와 EA 지원을 받으세요 직접 다운로드 — 여기를 클릭 [ D.I.C.E ] The DICE Indicator  Divergence in Chaos Environment는 엘리엇 파동 이론과 트레이딩 카오스 기법을 함께 사용하는 트레이더를 위해 설계된 MT5 전문 도구입니다. 가격 움직임의 숨겨진 및 일반 다이버전스를 감지하며, 빌 윌리엄스가 설명한 혼돈 시장 환경과 동기화됩니다. 주요 특징 엘리엇 파동 정렬 다이버전스: 파동 구조에 조화된 강세 및 약세 다이버전스를 탐지하여 파동 카운팅 정확도를 높입니다. 카오스 기법 통합: AO(오썸 오실레이터) 및 시장 구조 원칙과 일치하도록 설계되었습니다. 다중 타임프레임 스캐닝: 다양한 시간 프레임에서 다이버전스를 분석하여 모멘텀 변화와 추세 소진을 확인합니다. 시각적 알림 및 객체: 명확한 화살표, 선, 표시로 빠른 인식 가능. 적응형 시장 판독: 혼돈 시장 조건에 자동으로 조정되어 노이즈를 필터링하고 유효한 셋업만
Orderflow Scalp Pro v2.4   delivers institutional-grade trading intelligence through advanced volume analysis, dynamic VWAP calculations, real-time aggressive score monitoring, and precision arrow signals. This complete trading system transforms complex market data into clear, actionable signals for consistent profitability on 3-4 minute timeframes. Full Documentation: [Download PDF] Four Powerful Components in One System Volume Profile HeatMap with POC/VAH/VAL Transform your charts into inst
MonsterDash Harmonics Indicator is a harmonic pattern dashboard. It recognizes all major patterns. MonsterDash is a dashboard that displays all detected patterns for all symbols and (almost) all timeframes in sortable and scrollable format. Users can add their own user defined patterns . MonsterDash can open and update charts with the pattern found. Settings MonsterDash's default settings are good enough most of the time. Feel free to fine tune them to your needs. The color settings are for tho
The Volume Spread Analysis indicator is based on the original Volume Spread Analysis method. It was designed for quick and easy recognition of VSA patterns. Even though this indicator looks very simple, it is the most sophisticated tool we've ever made. It is a really powerful analytical tool that generates very reliable trading signals. Because it is very user-friendly and understandable, it is suitable for every type of trader, regardless of his experience. What is VSA? VSA - Volume Spread A
Meco Ultimate Channel
Thapelo Kapwe
5 (1)
This indicator belongs to the family of channel indicators. These channel indicator was created based on the principle that the market will always trade in a swinging like pattern. The swinging like pattern is caused by the existence of both the bulls and bears in a market. This causes a market to trade in a dynamic channel. it is designed to help the buyer to identify the levels at which the bulls are buying and the bear are selling. The bulls are buying when the Market is cheap and the bears a
무료 AUX 지표, EA 지원 및 전체 가이드를 얻으시려면 방문하세요 – https://www.mql5.com/en/blogs/post/763955 트렌드를 포착하세요. 패턴을 읽으세요. 진입 시점을 타이밍하세요. 30초 이내의 3단계! 분석 없이도 쉽게 거래하세요 — 당신의 스마트 어시스턴트가 워크플로우를 단순화해 드립니다. 더 이상 차트 과부하 없음. 스마트 바이어스 감지로 자신감 있게 거래하세요. 모든 통화, 암호화폐, 주식, 금속, 지수 및 모든 시간대와 호환됩니다. 그냥 클릭하고 실행하세요 — 정말 간단합니다. 속도와 명확성을 원하는 바쁜 트레이더에게 이상적입니다. TPTSyncX는 추세, 패턴, 그리고 캔들스틱 트리거 분석을 하나로 통합하여 깨끗하고 지능적인 시각 시스템으로 동기화하는 강력한 올인원 MetaTrader 5 인디케이터입니다. 명확성, 정밀성, 속도를 원하는 트레이더를 위해 설계되었으며, 가격 행동, 구조적 패턴 및 시장 타이밍 도구의 조합을 통해 높은 확
First time on MetaTrader, introducing IQ Star Lines - an original Vedic Astrology based indicator. "Millionaires don't use astrology, billionaires do" . - J.P. Morgan, Legendary American financier and banker. IQ Star Lines, an unique astrological indicator purely based on   Vedic astrology   calculations, published for the   first time on Metatrader.  This unique tool plots dynamic planetary grid lines based on real-time stars, constellations, and celestial movements, which allows you to plot t
Presenting one-of-a-kind Gann Indicator for XAUUSD IQ Gold Gann Levels is a non-repainting, precision tool designed exclusively for XAUUSD/Gold intraday trading. It uses W.D. Gann’s square root method to plot real-time support and resistance levels, helping traders spot high-probability entries with confidence and clarity. William Delbert Gann (W.D. Gann) was an exceptional market analyst whose trading technique was based on a complex blend of mathematics, geometry, astrology, and ancient calcul
Elliot Waves Analyzer Pro
Viktor Weidenthal
2.67 (3)
Elliot Waves Analyzer Pro calculates Elliot Waves to Help Identify Trend direction and Entry Levels. Mainly for Swing Trading Strategies. Usually one would open a Position in trend direction for Wave 3 or a Correction for Wave C . This Indicator draws Target Levels for the current and next wave. Most important Rules for Elliot Wave Analysis are verified by the Indicator.  The Pro version analyzes Multiple Timeframes and shows the Subwaves and Target-Levels.   For an Overview  " Elliot Waves Anal
This indicator uses support and resistance, volume and some special formula to calculate the volume to filter the candles. If the volume reaches a specific value, And at the same time, Candle breaks the support/resistance line, There would be a signal and we can enter the market. Signals appear when the current candle closes. then you can enter the trade when a new candle appears. Please don't forget to follow your money management plan. MT4 Version Support/Resistance Breakout MT4 :   https:/
제작자의 제품 더 보기
The indicator for Forex and Binary options is based on 2 standard indicators in MT4: ADX and RVI. The signals are received when the lines of both indicators intersect simultaneously. But the reverse of the signals is also written into the codes. This is when the signals are converted in the opposite direction. You can also enable and disable each of the indicators. And also 2 types of signals can be used in RVI: 1) Just when one line is above/below the other (this is good to use as a recoilles
Super volumes
Yerzhan Satov
4 (1)
The arrow indicator for Forex and Binary options is based on tick volumes. Unlike many volume indicators, the "Super volumes" indicator calculates bullish and bearish volumes and gives signals based on the predominance of any of them. If, say, there was an advantage of bullish volumes in this range at the moment, then the signal will be on Buy. Or if the predominance was bearish volumes, then, accordingly, the signal will be on Sell. In the indicator settings in the "volumes" variable, you can
Anaconda LD
Yerzhan Satov
The arrow indicator "Anaconda LD" is a reversal indicator for the Forex market and mainly for Binary options. The algorithm is written on the basis of reversal patterns. It is better to use it together with other indicators to filter signals. Even with the standard ones in MT4, even with other custom ones. Any channel indicators or level indicators are especially suitable... You need to select your expiration time for different assets. Which are 1-5 bars on different pairs.
Cripton
Yerzhan Satov
The arrow indicator for Binary Options and Forex is a reversal indicator. Created and written on the basis of reversal patterns. It is recommended for Binary Options to put it on the M5 chart. Enter into transactions for 1-3 bars. Depending on the trading sessions, you need to select your expiration time for a different asset.  You can change settings in external variables. Thus, you can both increase and decrease the frequency of signals. The arrows of the indicator do not draw at all. So you
The arrow indicator "Create a cool signal" for the Binary options and Forex market is a kind of constructor of its signals! In which you can choose your own signal conditions based on 10 standard MT4 indicators prescribed in it, plus another third-party buffer indicator that you can add to the "buffer indicators" variable. This is done simply! Prescribe the name of your indicator and prescribe its numbers (you will find them in the colors section where the numbers up to the buffer color are in
Highway pro
Yerzhan Satov
바이너리 옵션 및 외환"고속도로 이익"에 대한 지표는 채널 라인 뒤에 가격을 찾는 원칙을 기반으로합니다. 가격이 채널을 떠나 서서히 돌아 가기 시작하면 신호가 나타납니다. 그러한 지표를 거래하는 것은 매우 쉽고 편리합니다. 그리고 초보자 상인 또는 수년간의 경험을 가진 상인조차도 그것을 거래 할 수 있습니다. 각 자산에 대해 고유한 설정을 선택해야 합니다. 예를 들어,추세에 대한 막대를 계산하기 위한 기간입니다. 추세는 채널의 중간 선으로 표시됩니다. 녹색은 구매를 의미하고 붉은 색은 판매를 의미합니다. 또한"범위"변수에 설정된 다른 거래 세션에서 채널 폭을 조정해야합니다. 디지털 값이 높을수록 채널이 넓어집니다. 음,낮은 변수에서 편리한 화살표 및 선 매개 변수를 선택할 수 있습니다. 두께,막대에서 화살표의 거리,코드 및 색상. 화살표는 실시간으로 그려지지 않습니다. 그들은 바에서 바로 뛰어 사라지지 않습니다. 그러나 타임 스탬프를 전환 한 후 값을 변경합니다... 모두
Cool volumes
Yerzhan Satov
화살표 표시기"쿨 볼륨"은 틱 볼륨을 기반으로합니다. 표시기 자체는 특정 기간(기간 선택)에 구매 또는 판매 할 볼륨 수를 추적합니다. 판매자 또는 구매자의 볼륨의 비정상적인 초과가있을 때,그것은 판매 또는 구매 신호를 제공합니다. 색상 히스토그램은 아래 창에 그려져 있는데,녹색은 현재 구매자의 우위를 나타냅니다.이는 이 가격 범위에서 증가할 수 있는 잠재적 즉각적인 반전을 의미합니다. 반대로 붉은 색은 판매자의 우위를 나타내며 이는 잠재적 인 즉각적인 하향 반전을 의미합니다. 또한 시각적 인식의 편의를 위해 주 차트 창에 화살표가 직접 추가되었습니다. 사용자의 편의를 위해 외부 변수에는 신호의 주파수와 히스토리(히스토리 바)에 대한 설정 변수가 포함되어 있습니다. 그러나 값을 1000 이상으로 설정하지 않는 것이 좋습니다. 이 더 터미널의 성능이 느려집니다. 또한"===<<화살표 설정>>>==="섹션에서 화살표 및 히스토그램 매개 변수를 직접 설정할 수 있습니다. 히스토
Space signals
Yerzhan Satov
The Space signals signal indicator is my new development for trading on the Forex and Binary options markets. The algorithm of the indicator is written so that it tracks the trend and gives signals for the end of the corrective price movement. In the settings, you can set the signal period yourself. The higher the value in the "period" variable, the less frequent the signals will be. But they will naturally be of higher quality.  You can also choose the arrow codes on the chart, the distance
The indicator for Forex and Binary Options trading is based on the standard Mt4 Simple Moving Average indicator. But the difference from the standard indicator is that its lines are repainted in different colors depending on the state of the trend. If the color is green, then the trend is to buy. If it's red, then it's for sale. During a trend phase change, an audio alert appears along with a buffer on the chart in the middle of the lines. Thus, it is possible to determine the state of the trend
The new Dynamic PACK Hi Tf indicator is based on tick volumes. The middle line shows the average price for the selected period of the selected senior timeframe. The upper and lower lines show the maximum/minimum of the same selected period of the same timeframe. In the settings, the user can optionally choose which timeframe and bar calculation period he needs. You can also change the style, thickness, and color of each of the lines.  In the "StsrtBars" parameter, you can select the start peri
Level Delta
Yerzhan Satov
The Level DELTA indicator for MetaTrader 4 (MT4) – a powerful volume analysis tool that stands out with its capabilities and accuracy. Indicator Description The Level DELTA indicator is designed for volume analysis in a separate MT4 window. Its main task is to identify and display divergences, allowing traders to make more informed and timely decisions. Indicator Features Volume Analysis : The indicator analyzes volumes in financial markets, allowing you to see how volumes are distributed over d
The "Volume POC WVAP" Indicator is a revolutionary tool for traders seeking in-depth analysis across various financial markets. This unique indicator, based on tick volumes in the MT4 terminal, provides indispensable information for making informed trading decisions in the following markets: Forex, binary options, cryptocurrency, spot, futures, and indices. Key Features: WVAP Line: Weighted Volume Average Price: The WVAP calculates the weighted volume average price on the selected timeframe, all
POC, Volume Profile, Market Profile, Volume Indicator, Dynamic POC, Tick Volume, Forex Volume The Dynamic POC Hi Tf Arrow indicator is a reliable volume analysis tool (volume profile, market profile, tick volume) for accurately determining POC levels and price reactions. Dynamic POC Hi Tf arrow for MT4 Description Dynamic POC Hi Tf arrow is a professional volume analysis indicator designed to accurately identify key price levels and market direction. It is built on tick volume data and displ
Quantum Empire GRID PRO - Next Generation Trading System Revolutionary Trading Technology Quantum Empire GRID PRO represents a breakthrough in automated trading, combining intelligent grid strategy with averaging system and signal filtering. After 2+ years of real-market testing, this EA has proven its stability and profitability across various asset classes. Key Features: Smart Averaging System : When closing a series of trades, profit averages 3:1 relative to losses 4 Signal Mode
Quqntum Delta
Yerzhan Satov
The Quantum   DELTA indicator for MetaTrader 5 (MT5) – a powerful volume analysis tool that stands out with its capabilities and accuracy. Indicator Description The Quantum   DELTA indicator is designed for volume analysis in a separate MT5 window. Its main task is to identify and display divergences, allowing traders to make more informed and timely decisions. Indicator Features Volume Analysis : The indicator analyzes volumes in financial markets, allowing you to see how volumes are distribute
Title: MACD Signals Discover the MACD Signals indicator – your reliable assistant in the world of trading! Description: The "MACD Signals" indicator is designed to make your trading more successful and efficient. It displays signals on the main chart as bright vertical lines that are easy to spot. You can customize the color and thickness of these lines to perfectly match your style and preferences. Features: Signals: Vertical lines on the main chart that stand out among other elements.
필터:
리뷰 없음
리뷰 답변