GraphicPatternsBuilder
- Indicatori
- Versione: 2.0
- Aggiornato: 15 agosto 2025
- Attivazioni: 5

Description of the "GraphicPatternsBuilder" Indicator
Principle of Operation and Advantages:
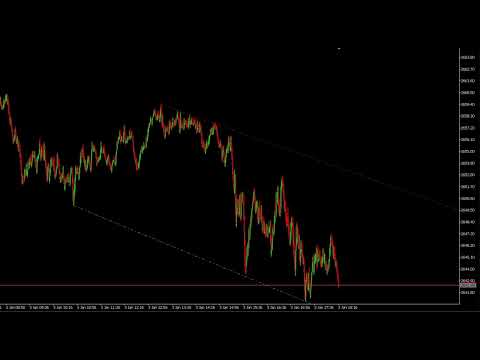
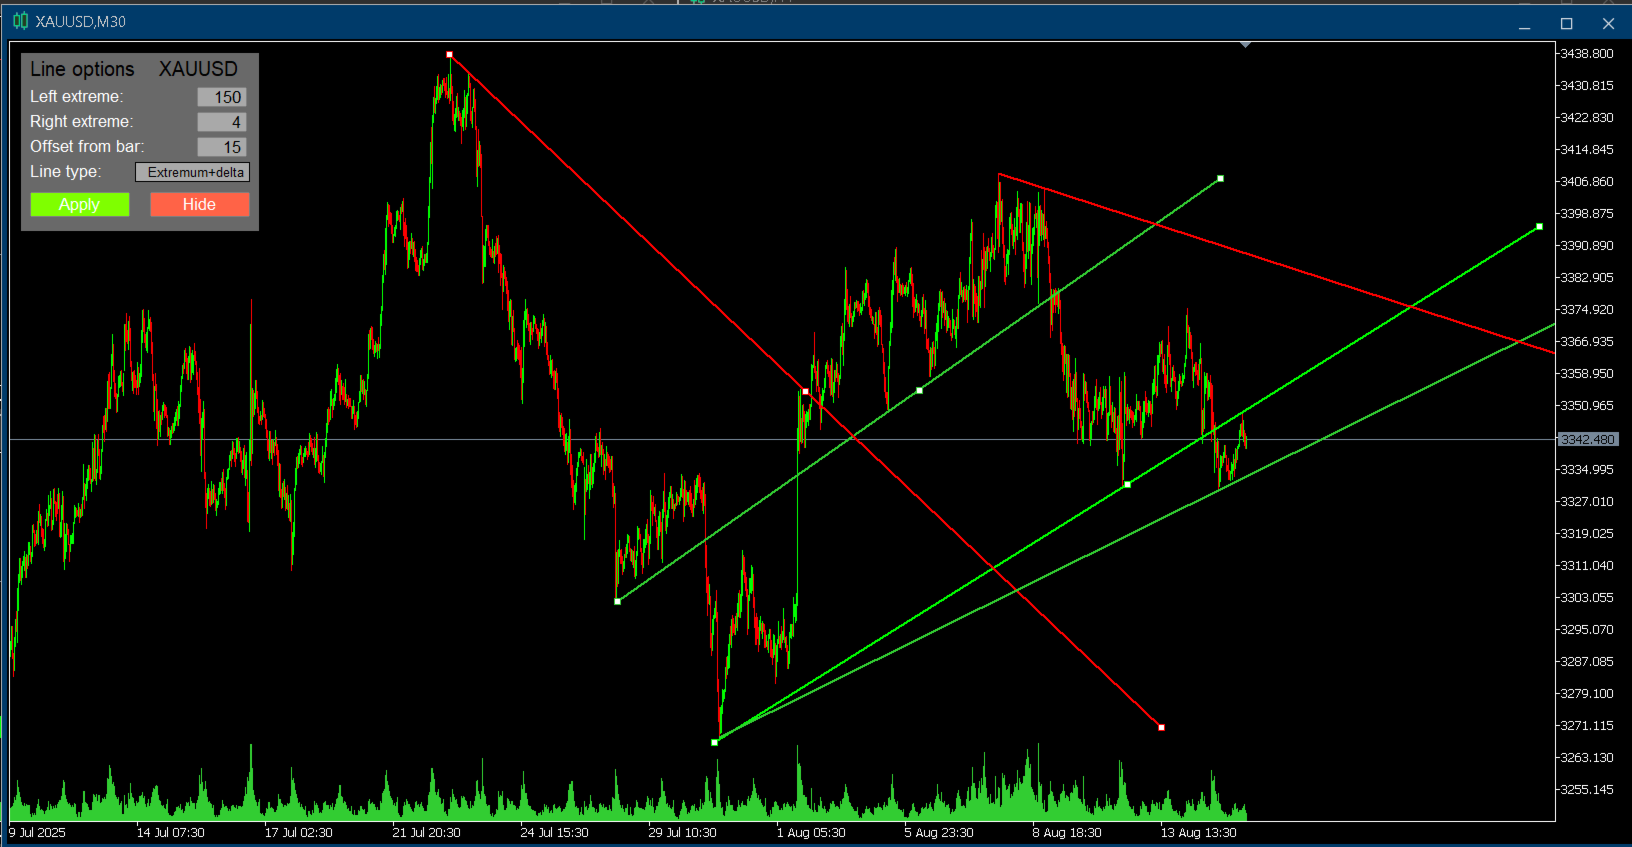
The indicator automatically plots support (green) and resistance (red) lines on the chart, identifying key price levels. Works on any asset (cryptocurrency, stocks, Forex) and all timeframes.
Key Advantages:
1. Automation of Routine Work – The indicator independently identifies significant extrema and draws lines.
2. Two Construction Algorithms :
- Type 1 : Line is built using two extrema (left and right).
- Type 2 : Line starts from an extremum and extends with minimal slope to the current zone.
3. Adaptability – Accounts for market volatility; does not redraw lines after bar formation.
4. Professional Visualization – Customize colors, thickness, and line styles to match your trading style.
Indicator Parameters
Basic Settings:
1. Line type :
- `By 2 extremums` – Classic construction via two extrema.
- `Extremum and delta` – Finds the line with minimal slope from the extremum.
2. Left extreme (default: 20):
- Number of bars *to the left* of the extremum confirming its significance.
3. Right extreme (for Type 1, default: 3):
- Number of bars *to the right* of the extremum for confirmation.
4. Offset from current bar (for Type 2, default: 3):
- Offset from the current bar to search for the endpoint of the line.
5. Consider the bar before the extreme (option for Type 2):
- Accounts for the bar preceding the extremum for more accurate calculation.
Display Settings:
- Color, thickness, and line style (dashed, solid, etc.).
- Auto-adjustment for dark/light chart themes.
Installation and Usage
Step 1: Installation in MT5
1. Download the file `GraphicPatternsBuilder.ex5`.
2. In MT5: File → Open Data Folder → MQL5 → Indicators.
3. Copy the file into the `Indicators` folder.
4. Restart MT5 or refresh the Navigator panel (Ctrl+N).
Step 2: Adding to Chart
1. Open an asset chart (e.g., BTCUSD).
2. In the Navigator panel, find the indicator under Custom Indicators.
3. Drag it onto the chart → configure parameters → click OK.
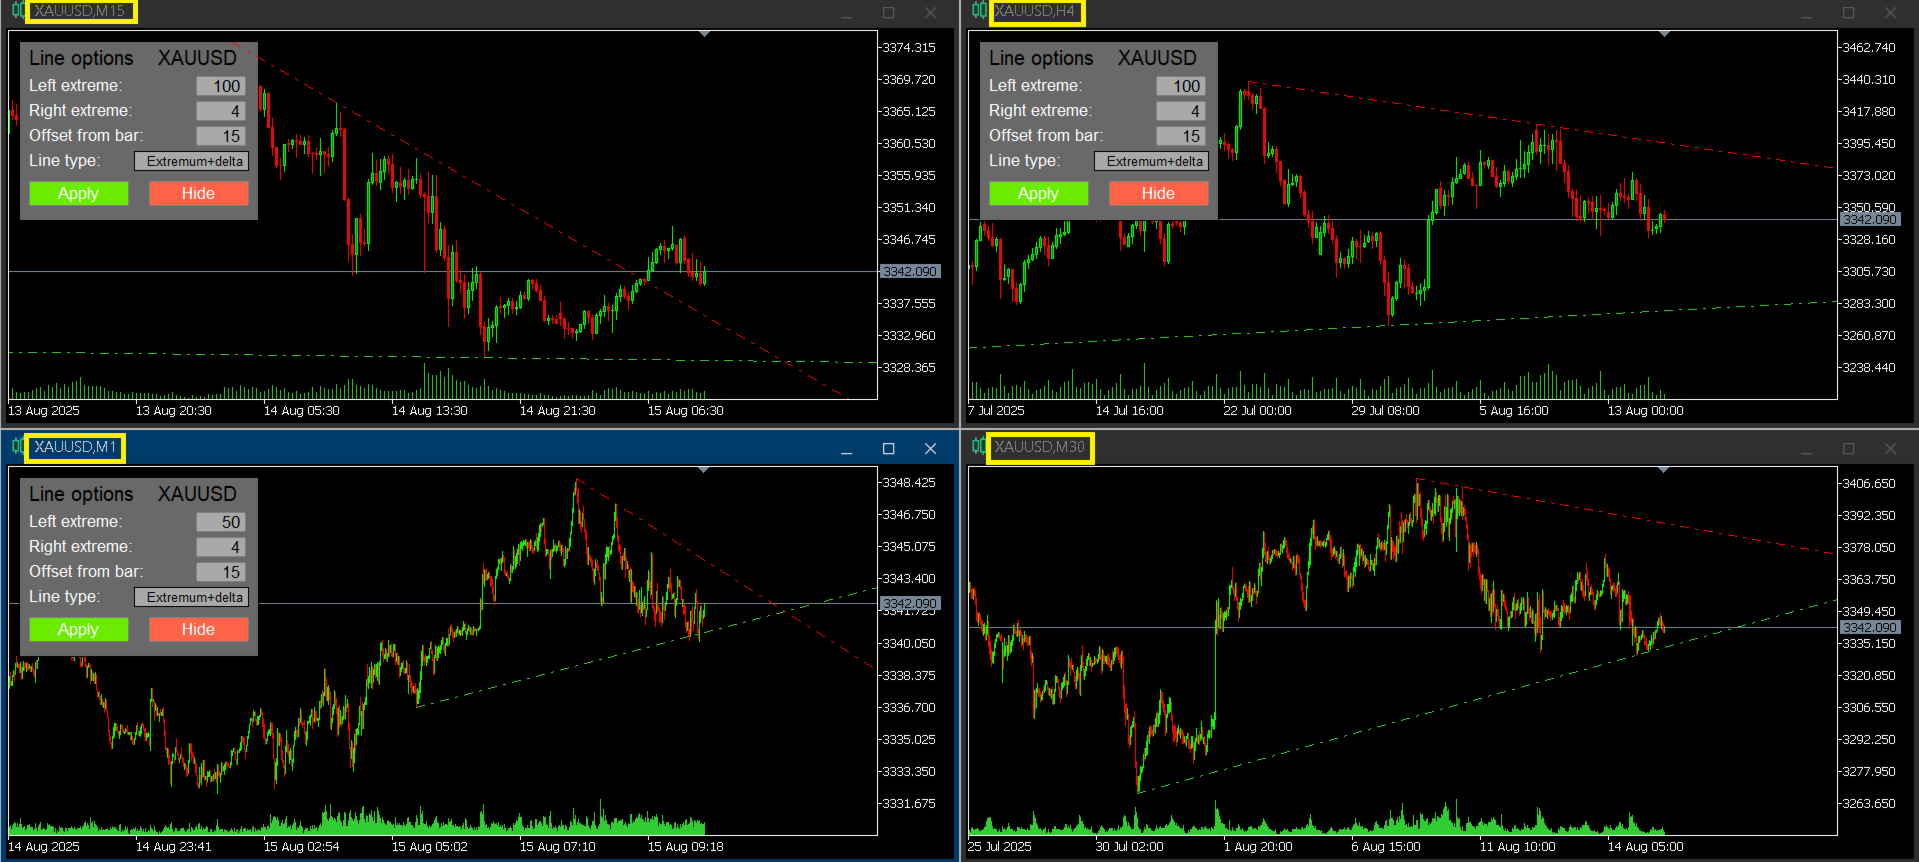
Step 3: Working with the Control Panel
- Apply: Apply new parameters (lines will rebuild).
- Hide: Hide the settings panel.
- Use the dropdown list to switch line types.
Trading Strategies for the Crypto Market
Strategy 1: Bounce from Levels
- Buy: When price touches support + confirmation signals (e.g., volume or "hammer" candlestick pattern).
- Sell: When testing resistance line + bearish patterns ("shooting star").
Strategy 2: Breakout of Level
- Support breakout → SELL signal. Stop-loss above the broken level.
- Resistance breakout → BUY signal. Stop-loss below the level.
Important for Cryptocurrencies:
- Lines are more accurate on H1+ timeframes.
- During high volatility (e.g., news), use Type 2: it accounts for trend "flatness".
- Combine with volume indicator: breakout with rising volume = strong signal.
Pattern Examples
1. Triangle:
- Support/resistance lines converge → breakout in trend direction.
2. Flag/Pennant:
- Correction to support line after sharp movement → trend continuation.
Key Notes
- Lines do not redraw after bar closure – eliminates false signals.
- For H4-W1 timeframes, reduce `Left extreme` (to 5–10).
- Use Type 1 in sideways markets, Type 2 in trends.
- Always apply the indicator to **major crypto pairs**: BTC/USD, ETH/USD, XRP/USD.
⚠️ Risk Management: Support/resistance lines are analysis tools, not guarantees. Always use stop-losses!
The indicator saves hours of manual work and helps you see the market through a professional trader’s eyes. For maximum efficiency, test parameters against your trading system!