SpectorMA

5
  • Indicatori
  • Sergii Krasnyi
    Sergii Krasnyi
    Dear ladies and gentlemen, members of the stock market, Greetings.
    My name is Sergey Krasny, and I have been involved in trading and programming for more than ten years.
    My path in studying this field started in 2011, and I realized my first custom project in 2013.
  • Versione: 1.40
  • Aggiornato: 25 marzo 2024
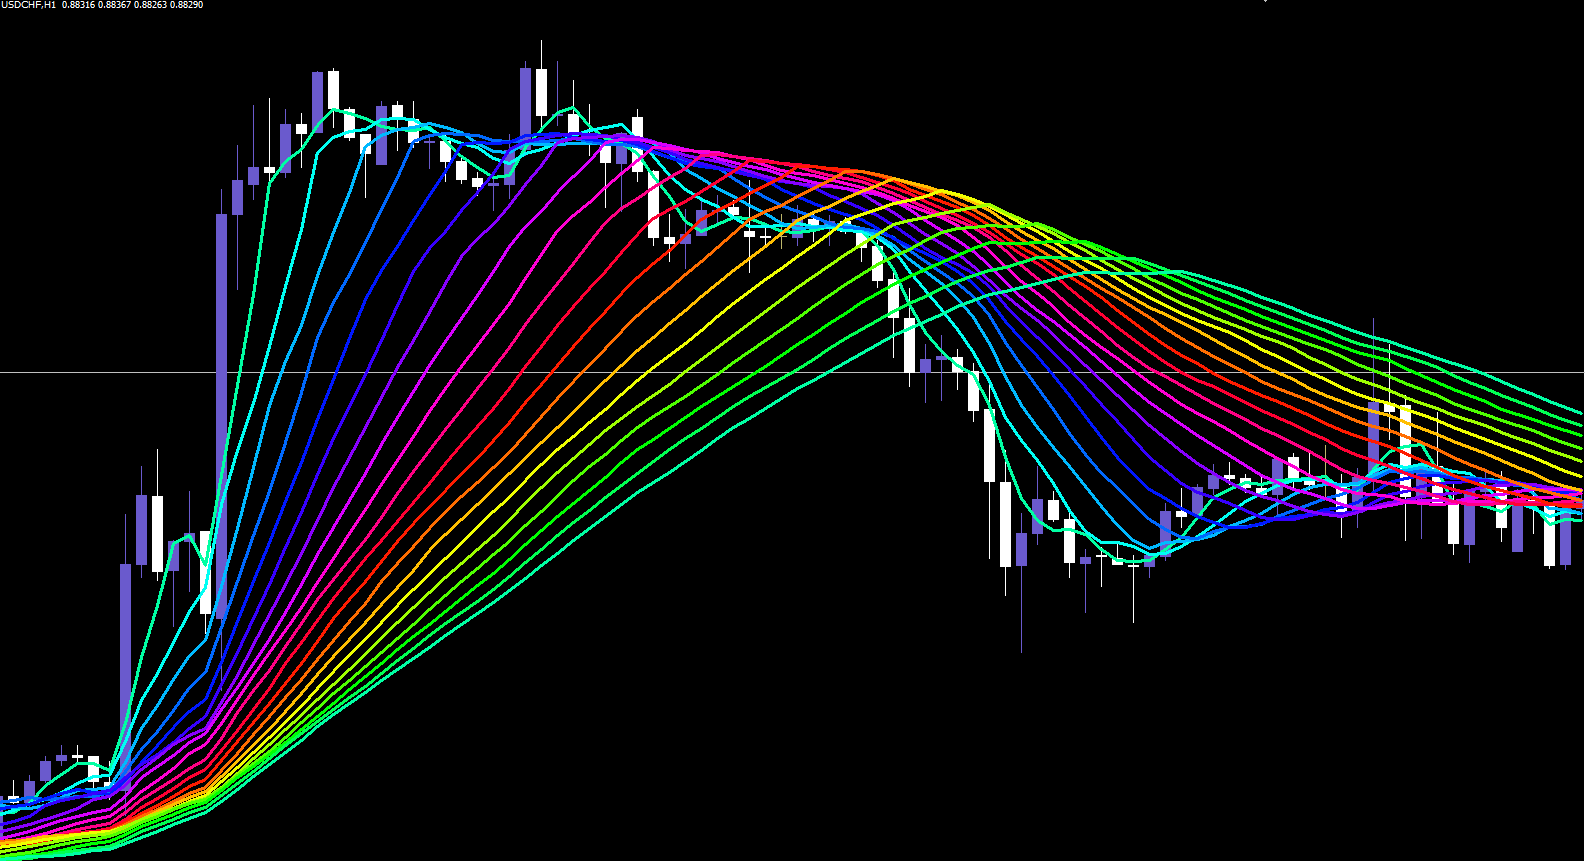
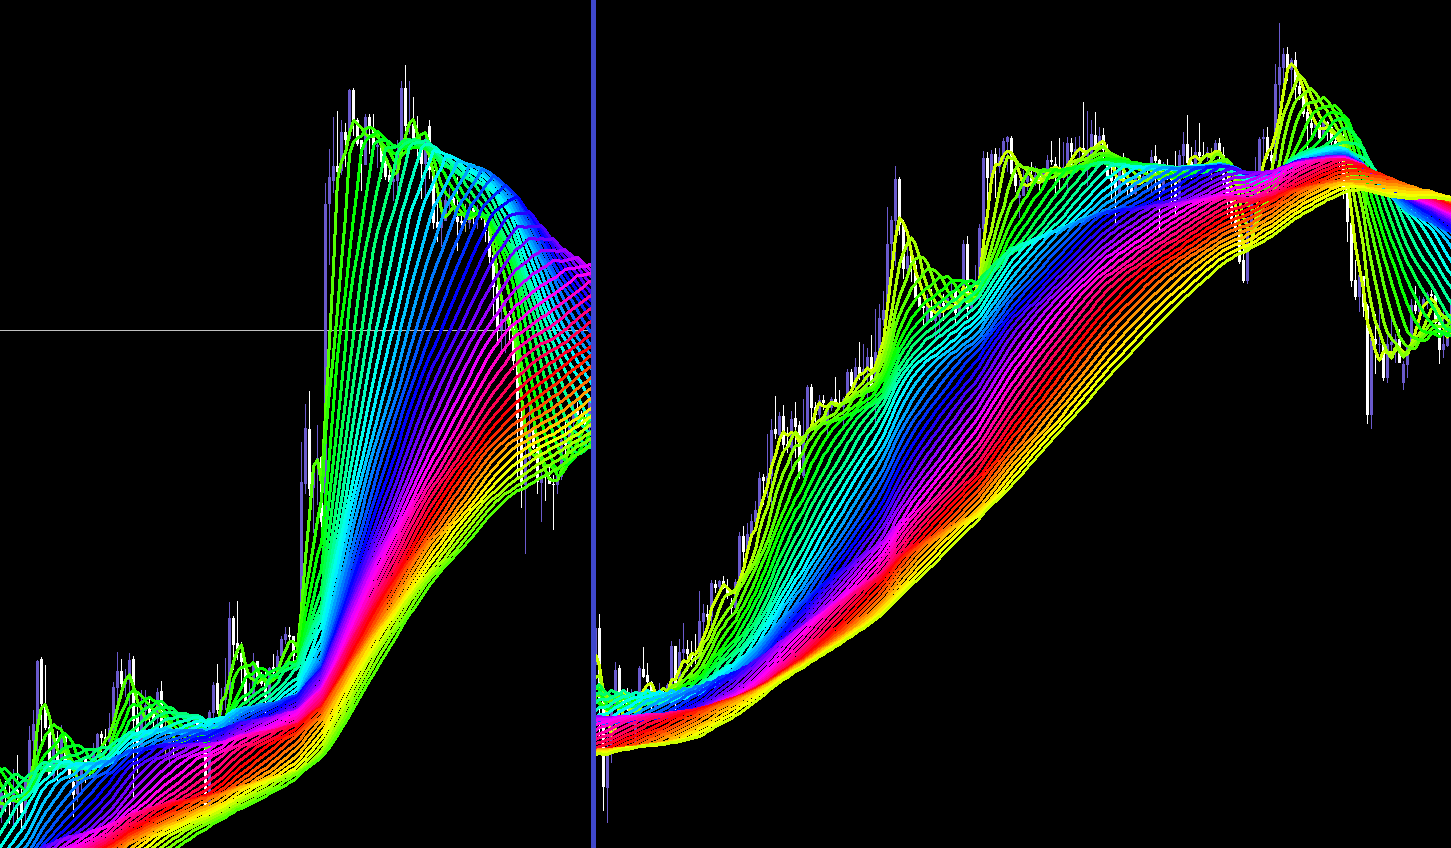
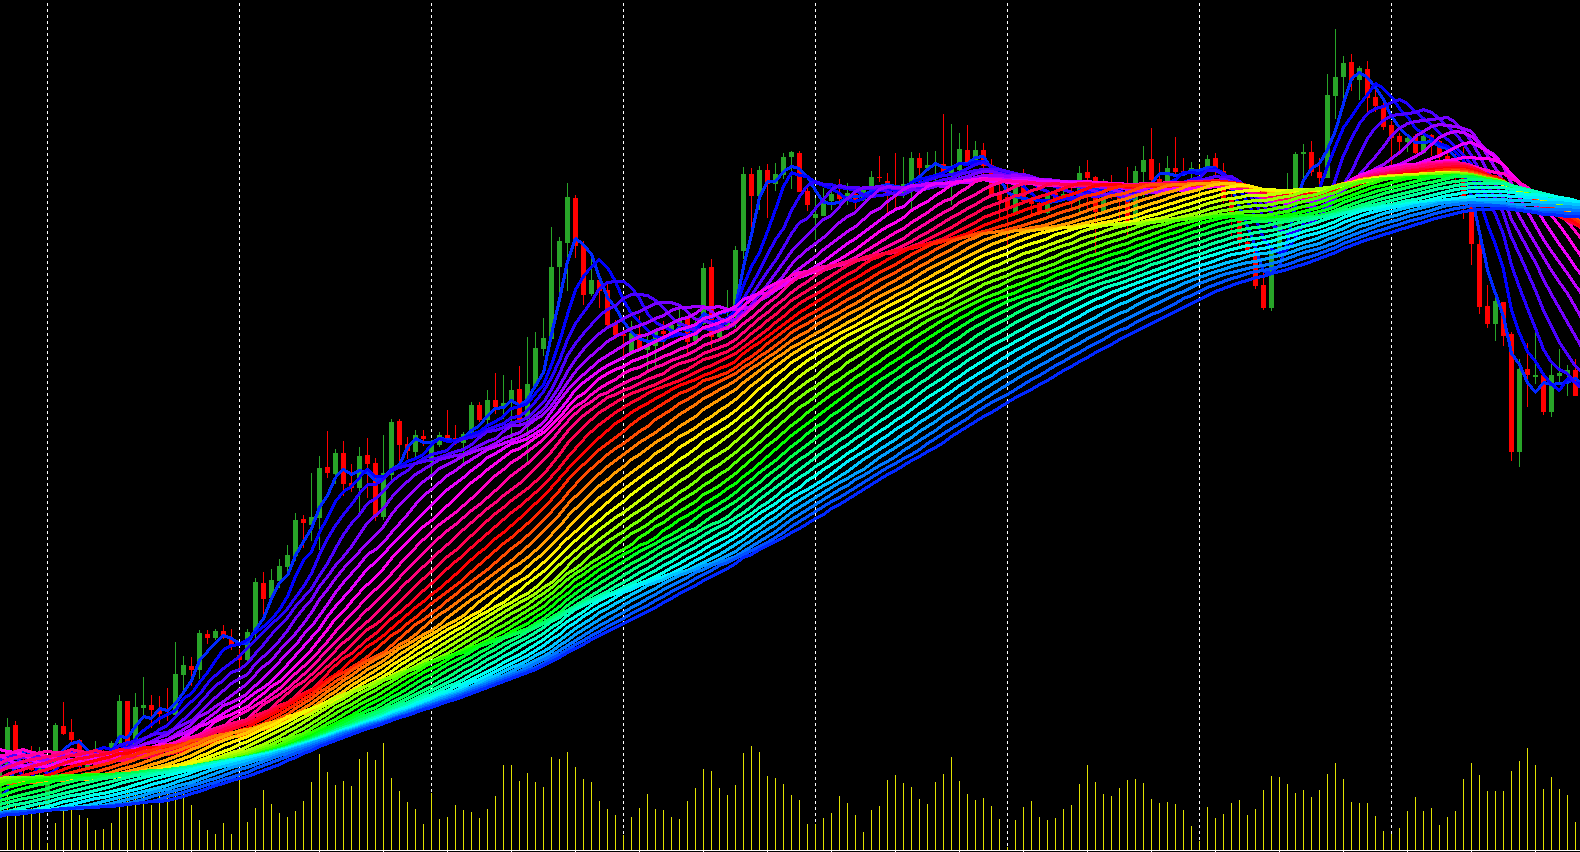
Vi presentiamo un indicatore che non solo migliora l'aspetto visivo del grafico, ma gli conferisce anche un carattere vivace e dinamico. Il nostro indicatore è una combinazione di uno o più indicatori di media mobile (MA) che cambiano costantemente colore, creando un aspetto interessante e colorato.

Questo prodotto è una soluzione grafica, quindi è difficile descrivere ciò che fa nel testo, è più facile vederlo scaricandolo, inoltre il prodotto è gratuito.
Questo indicatore è adatto ai blogger che vogliono creare una bella immagine di un grafico per l'editing video o ai trader che vogliono rendere il loro grafico vivace e colorato.

La tavolozza dei colori delle linee MA cambia come un arcobaleno o cambia in modo casuale (a seconda dei parametri impostati). Gli indicatori MA si allineano in modo indipendente mantenendo il passo nel parametro "periodo MA", creando così una bella immagine.

L'indicatore ha anche la capacità di cambiare costantemente il periodo MA, il che consente di creare un effetto di vivacità e dinamismo sul grafico. 

Grazie per l'attenzione.
Con i migliori auguri.
Recensioni 4
Abraham Correa
4658
Abraham Correa 2024.06.23 05:52 
 

Straight up respect for the upload of the indicator.

Prodotti consigliati
SC MTF Rsi MT4
Krisztian Kenedi
5 (1)
Indicatore dell'Indice di Forza Relativa (RSI) con supporto multi-timeframe, segnali visivi personalizzabili e sistema di avvisi configurabile. Servizi di programmazione freelance, aggiornamenti e altri prodotti TrueTL sono disponibili sul mio profilo MQL5 . Feedback e recensioni sono molto apprezzati! Cos'è il RSI? Il Relative Strength Index (RSI) è un oscillatore di momentum che misura la velocità e l'entità delle variazioni di prezzo. L'indicatore oscilla tra 0 e 100, confrontando l'entità
FREE
Extremum Reverse Bar
Yurij Izyumov
2.8 (5)
This indicator has been created for finding the probable reversal points of the symbol price. A small candlestick reversal pattern is used it its operation in conjunction with a filter of extremums. The indicator is not redrawn! If the extremum filter is disabled, the indicator shows all points that have a pattern. If the extremum filter is enabled, the condition works – if the history Previous bars 1 candles back contains higher candles and they are farther than the Previous bars 2 candle, such
FREE
Identify Trend
Aleksey Ivanov
4.13 (24)
The Identify Trend indicator, using fairly simple but robust filtering methods (based on the moving median – algorithm XM )  and more complex algorithms (XC, XF, XS, four types of non-lagging moving averages   SMAWL, EMAWL,  SSMAWL, LWMAWL ) developed by the author , allows determined (1) the beginning of a true trend movement very precisely and, most importantly, with a small delay, and (2) identifying the flat. Such an indicator can be used for trading scalper strategies as well
FREE
Rsi Style
Javier Morales Fernandez
Perché lo stile è importante So quanto sia fastidioso fare clic ogni volta sulle proprietà per cambiare il colore della candela, lo sfondo chiaro o scuro e inserire o rimuovere la griglia. Ecco la soluzione con un solo clic: Tre pulsanti personalizzabili per scegliere lo stile di candela che gli operatori desiderano. Un pulsante per passare dalla modalità Giorno a quella Notte. Un pulsante per mostrare o nascondere la griglia sui grafici.  ***** Nelle impostazioni è possibile scegliere dove vi
FREE
MACD in MA
Nikolaos Pantzos
iMACD in iMA is indicator to change color in iMA if iMACD is upper of zero (up trend) or lower of zero (down trend). It is a useful tool to track when the upside and the downside iMACD on iMA. You can to get source code from here . Parameters MA_Periods — Period for iMA. MA_Method — Method for iMA. MACD_FastEMA — Fast EMA for MACD. MACD_SlowEMA — Slow EMA for MACD. MACD_SignalSMA — SMA signal for MACD. MACD_ApliedPrice — Price used for MACD. BarsCount — How many bars will show the line. Revers
FREE
BoxInside MT4
Evgeny Shevtsov
4.83 (6)
This indicator calculates the volume profile and places labels that correspond to the VAH, VAL and POC levels, for each candle individually. Indicator operation features The indicator works on the timeframes from M5 to MN, but it uses the history data of smaller periods: M1 - for periods from M5 to H1, M5 - for the H4 period, M30 - for the D1 period, H4 - for the W1 period, D1 - for the MN period. The color and location of the VAL, VAH and POC labels on the current candle are considered to be c
FREE
1、能显示货币之间的强弱 0是最弱 7是最强 2、能显示28个货币以及黄金 原油的 涨跌幅度 3、能切换货币对 4、能显示持仓订单的货币对 1、能显示货币之间的强弱 0是最弱 7是最强 2、能显示28个货币以及黄金 原油的 涨跌幅度 3、能切换货币对 4、能显示持仓订单的货币对 5、能利用键盘的的上下键切换货币对,左右键切换周期 1、能显示货币之间的强弱 0是最弱 7是最强 2、能显示28个货币以及黄金 原油的 涨跌幅度 3、能切换货币对 4、能显示持仓订单的货币对 5、能利用键盘的的上下键切换货币对,左右键切换周期 5、能利用键盘的的上下键切换货币对,左右键切换周期 1、能显示货币之间的强弱 0是最弱 7是最强 2、能显示28个货币以及黄金 原油的 涨跌幅度 3、能切换货币对 4、能显示持仓订单的货币对 5、能利用键盘的的上下键切换货币对,左右键切换周期
FREE
Stochastic Rsi Style
Javier Morales Fernandez
Perché lo stile è importante So quanto sia fastidioso fare clic ogni volta sulle proprietà per cambiare il colore della candela, lo sfondo chiaro o scuro e inserire o rimuovere la griglia. Ecco la soluzione con un solo clic: Tre pulsanti personalizzabili per scegliere lo stile di candela che gli operatori desiderano. Un pulsante per passare dalla modalità Giorno a quella Notte. Un pulsante per mostrare o nascondere la griglia sui grafici.  ***** Nelle impostazioni è possibile scegliere dove vi
FREE
Wise Men Indicator demo
Bohdan Kasyanenko
3 (2)
The indicator displays signals according to the strategy of Bill Williams on the chart. Demo version of the indicator has the same features as the paid, except that it can work only on a demo account . Signal "First Wise Man" is formed when there is a divergent bar with angulation.  Bullish divergent bar - with lower minimum and closing price in the upper half. Bearish divergent bar - higher maximum and the closing price at the bottom half. Angulation is formed when all three lines of Alligator
FREE
RJT Salamander for MT4
Rafael Jimenez Tocino
RJT SALAMANDER, the indicator as in a video game VERSION 2 Pilot your PRICE spaceship inside the cavern and avoid the collision against the stalactites (green) and stalagmites (red), dodging these obstacles to win. When these objects are forming (or disappearing) then you must make the decision how to move your ship (just like in a video game) Depending on the market and the size of the candles/bars you can adjust the calculation of stalactites and stalagmites (based on the last bars) in the
FREE
Two Lines Color
Cristobal Hidalgo Soriano
Nombre del Indicador: Two Lines Color 1 Telegran:13 Crow Trading Club Descripción: Este indicador personalizado para MetaTrader 4, "Two Lines Color 1", es una herramienta de análisis técnico diseñada para ayudarte a identificar oportunidades de trading en los mercados financieros. Este indicador utiliza dos Medias Móviles Simples (SMA) de diferentes períodos y las representa en el gráfico con dos líneas de colores distintos. Las características clave de este indicador son las siguientes: Rá
FREE
Mr Beast Sniper
Luis Mariano Vazquez Marcos
5 (1)
Asesor Experto "Sniper FX": Precisión Milimétrica para Tus Operaciones El asesor experto "Sniper FX" redefine la precisión en el trading automatizado al ofrecer un enfoque estratégico centrado en pocas, pero extraordinariamente precisas, entradas en el mercado. Inspirado por la agudeza de un francotirador, este asesor experto utiliza algoritmos avanzados para identificar oportunidades óptimas de compra y venta, maximizando el potencial de beneficios mientras minimiza la exposición al mercado.
FREE
This indicator will mirror the assets in use in another metatrader, being able to choose the timeframe and a template. This is the Metatrader 4 Client, it needs the Metatrader 4 or 5 Server versions: Metatrader 4 Mirror Chart Server: https://www.mql5.com/en/market/product/88644 Metatrader 5 Mirror Chart Server:   https://www.mql5.com/en/market/product/88652 Details of how it works in the video.
FREE
Pin Bars
Yury Emeliyanov
5 (5)
Scopo principale: "Pin Bars" è progettato per rilevare automaticamente le barre dei pin sui grafici dei mercati finanziari. Una barra pin è una candela con un corpo caratteristico e una lunga coda, che può segnalare un'inversione di tendenza o una correzione. Come funziona: L'indicatore analizza ogni candela sul grafico, determinando la dimensione del corpo, della coda e del naso della candela. Quando viene rilevata una barra pin corrispondente a parametri predefiniti, l'indicatore la segna su
FREE
Apex Drawdown
Carl Christian Nyberg
Uncomplicated straightforward indicator that shows the maximum account drawdown since the indicator was added to the chart. The indicator does not take transaction history into account since it is impossible to calculate drawdown from historical entries en closures of trades. The indicator will be free in this basic form. Eventually it will be developed but the focus is to keep it plain and simple.
FREE
RedeeCash Rate of Change
Patrick Odonnell Ingle
Tasso di cambio In base alla formula, ROC = (Close[n] - Close[n-lookback]) / Close[n-lookback] * 100 per tracciare il tasso di variazione dell'azione del prezzo di una coppia di valute in un periodo di ricerca e fornisce due variabili globali, SYMBOL_ROC e SYMBOL_ROC_LOOKBACK, che rappresentano l'ultimo valore del tasso di variazione e il tasso di variazione nel periodo di ricerca precedente. Invocando l'indicatore utilizzando la funzione iCustom, iCustom ( "Market/RedeeCash_Rate_of_Change.ex4
FREE
OsMA Arrow
Pavel Shutovskiy
3.83 (6)
The indicator displays crossing zero level by Moving Average of Oscillator (OsMA) in the form of arrows. The indicator notifies about a signal by means of a pop-up Alert window, or sending notification to e-mail. Parameters Fast EMA Period - fast EMA. This is an exponential moving average from a price with a short period. Slow EMA Period - slow EMA. This is also an exponential moving average of a market price but with a longer period. Signal SMA Period - MACD SMA. This is a signal line which is
FREE
Plot results
Vladimir Tkach
4 (4)
The indicator displays on a chart trading results. You can configure the color and font of displayed results, as well as filter trades based on the magic number. If multiple trades were closed within one bar of the current timeframe, the result is summed and output in one value. Utility parameters Plot profit in - the format of output results: wither in deposit currency taking onto account commission and swap, or in points. Start from - start processing data at the specified time. Plot last dea
FREE
Enhanced Volume Profile: The Ultimate Order Flow & Liquidity Analysis Tool Overview Enhanced Volume Profile   is an indicator for MetaTrader 5 that displays the traded volume at specific price levels over a defined period. It separates the total volume into buy and sell components, presenting them as a side-by-side histogram on the chart. This allows users to observe the volume distribution and the proportion of buy and sell volumes at each price level. Graphics Rendering The indicator uses t
FREE
PZ Penta O MT4
PZ TRADING SLU
2.33 (3)
The Penta-O is a 6-point retracement harmonacci pattern which usually precedes big market movements. Penta-O patterns can expand and repaint quite a bit. To make things easier this indicator implements a twist: it waits for a donchian breakout in the right direction before signaling the trade. The end result is an otherwise repainting indicator with a very reliable trading signal. The donchian breakout period is entered as an input. [ Installation Guide | Update Guide | Troubleshooting | FAQ | A
FREE
Free automatic Fibonacci is an indicator that automatically plots a Fibonacci retracement based on the number of bars you select on the BarsToScan setting in the indicator. The Fibonacci is automatically updated in real time as new highest and lowest values appears amongst the selected bars. You can select which level values to be displayed in the indicator settings. You can also select the color of the levels thus enabling the trader to be able to attach the indicator several times with differe
FREE
Cumulative Delta MT4
Evgeny Shevtsov
4.86 (29)
The indicator analyzes the volume scale and splits it into two components - seller volumes and buyer volumes, and also calculates the delta and cumulative delta. The indicator does not flicker or redraw, its calculation and plotting are performed fairly quickly, while using the data from the smaller (relative to the current) periods. The indicator operation modes can be switched using the Mode input variable: Buy - display only the buyer volumes. Sell - display only the seller volumes. BuySell -
FREE
Stochastic Arrow
Anton Iudakov
4.5 (4)
The indicator has combined 5 popular strategies. Draws an arrow after confirming a signal for the selected strategy. There are signal alerts. Doesn't redraw its values. I recommend watching my advisor -   Night Zen EA 5 strategies. The main line crosses the signal line. The main line crosses the signal line in the oversold (for buy) / overbought (for sell) zones. The main line enters the oversold (for sell) / overbought (for buy) zones . The main line comes out of the oversold (for buy ) / over
FREE
Marginhedged   Information indicator. Lot - set the required lot for calculations, set using the input field MARGININIT - Initial margin requirements for the specified lot MARGINHEDGED - Margin charged from overlapped orders per set lot PERCENT -   Margin charged on overlapped orders expressed as a percentage Description of indicator settings: _color - set color An example of using the indicator: One buy position with lot 1 is open in the market, the margin requirements in this case correspond t
FREE
Traditional MACD MT4
Daniel Lewis
4.58 (55)
MACD indicator in MetaTrader 4/5 looks different than MACD does in most other charting software. That is because the MetaTrader 4/5 version of MACD displays the MACD line as a histogram when it is traditionally displayed as a line. Additionally, the MetaTrader 4/5 version computes the Signal line using an SMA, while according to MACD definition it is supposed to be an EMA. The MetaTrader 4/5 version also does not compute a true MACD Histogram (the difference between the MACD/Signal lines). This
FREE
Calculator of Lot Size
Mihails Babuskins
4.52 (23)
Calculation of Lot Size for many traders is a big challenge. A case that is very important in money management. What many traders ignore. Choosing an appropriate Lot Size in trades can improve results and it will ultimately lead to success. This indicator calculates the authorized Lot Size for your trades. The indicator uses the following values to get the appropriate Lot Size for positioning: The distance of Stop Loss. The Pip Value. The amount of Risk Allowed For Each Trade. The amoun
FREE
Sm Ichimoku Scanner
Steeve Christian Martol
5 (5)
Multi Time Frame Indicator acts as a Scanner based on the Ichimoku Trading System. The outcome is displayed on a board. This helps you to make "at a glance" a mental picture of the System without having to open the chart. Up to 10 Currencies can be watched. Scanned elements And Legend "KUMO Futur" - Green : The Kumo Futur is Bullish. "KUMO Futur" - Red : The Kumo Futur is Bearish. "PRICE Cross KJ" - Green : The Price is Above the Kijun Sen.  "PRICE Cross KJ" - Red : The Price is Below the Kijun
FREE
CandleCloseCountdown
Adriaan Abraham Slingerland
CandleCloseCountdown is technically an indicator. Its purpose is to show the time a candle has left on a given timeframe before it closes. All possible time frames of MetaTrader 4 are supported. The way the remaining time is displayed depends on the selected timeframe. For M1 only the seconds   are displayed. Above that at all timeframes up to H1 the remaining minutes and seconds are displayed and so on for timeframes above D1.
FREE
Forex Market Profile and Vwap
Lorentzos Roussos
4.86 (7)
Profilo del mercato Forex (FMP in breve) Cosa non è: FMP non è il classico display TPO con codice alfabetico, non mostra il calcolo generale del profilo dati del grafico e non segmenta il grafico in periodi e non li calcola. Cosa fa : Soprattutto, l'indicatore FMP elaborerà i dati che risiedono tra il bordo sinistro dello spettro definito dall'utente e il bordo destro dello spettro definito dall'utente. L'utente può definire lo spettro semplicemente tirando ciascuna estremità dell'indicatore
FREE
Indicator Panel is a tool designed to manage the visibility of technical analysis objects generated by our indicators. Instead of enabling/disabling individual indicators or manually removing chart objects, a single checkbox click allows you to show or hide a selected indicator from the chart. The panel enables quick toggling of: Pivot Points (PP, R1–R3, S1–S3) High/Low Levels (previous day, week, and month) Liquidity Lines HTF Candles (Higher Timeframe Candles) FVG Zones (Fair Value Gap Zones)
FREE
Gli utenti di questo prodotto hanno anche acquistato
Neuro Poseidon MT4
Daria Rezueva
4.94 (31)
Neuro Poseidon is a new indicator by Daria Rezueva. It combines precise trading signals with adaptive TP/SL levels - creating best possible trades as a result! Message me and get  Neuro Poseidon Assistant  as a gift to automize your trading process! What makes it stand out? 1. Proven profitability on all assets and timeframes 2. Only confirmed BUY and SELL signals present on the chart 3. Adaptive TP & SL levels generated by the software for each trade 4. Easy to understand - suitable for all
Gann Made Easy
Oleg Rodin
4.84 (164)
Gann Made Easy è un sistema di trading Forex professionale e facile da usare che si basa sui migliori principi del trading utilizzando la teoria di mr. WD Gann. L'indicatore fornisce segnali ACQUISTA e VENDI accurati, inclusi i livelli di Stop Loss e Take Profit. Puoi fare trading anche in movimento utilizzando le notifiche PUSH. CONTATTAMI DOPO L'ACQUISTO PER RICEVERE GRATUITAMENTE LE ISTRUZIONI DI TRADING E OTTIMI INDICATORI EXTRA! Probabilmente hai già sentito parlare molte volte dei metodi d
Dynamic Forex28 Navigator
Bernhard Schweigert
4.43 (7)
Dynamic Forex28 Navigator - Lo strumento di trading Forex di nuova generazione. ATTUALMENTE SCONTATO DEL 49%. Dynamic Forex28 Navigator è l'evoluzione dei nostri indicatori popolari di lunga data, che combinano la potenza di tre in uno: Advanced Currency Strength28 Indicator (695 recensioni) + Advanced Currency IMPULSE con ALERT (520 recensioni) + CS28 Combo Signals (Bonus). Dettagli sull'indicatore https://www.mql5.com/en/blogs/post/758844 Cosa offre l'indicatore di forza di nuova generazione?
M1 Sniper
Oleg Rodin
5 (24)
M1 SNIPER è un sistema di indicatori di trading facile da usare. Si tratta di un indicatore a freccia progettato per l'intervallo temporale M1. L'indicatore può essere utilizzato come sistema autonomo per lo scalping sull'intervallo temporale M1 e come parte del tuo sistema di trading esistente. Sebbene questo sistema di trading sia stato progettato specificamente per il trading sull'intervallo temporale M1, può comunque essere utilizzato anche con altri intervalli temporali. Inizialmente ho pro
Scalper Inside PRO
Alexey Minkov
4.74 (68)
Scalper Inside PRO Scalper Inside PRO is an intraday trend and scalping indicator for MetaTrader 4 that uses an exclusive algorithm to quickly detect market direction and key target levels. It automatically calculates entry, exit and multiple profit targets, and shows detailed performance statistics so you can see how different instruments and strategies performed. This helps you choose the most suitable trading instruments for the current market conditions. Additionally, you can easily integrat
Enigmera
Ivan Stefanov
5 (8)
ENIGMERA: Il cuore del mercato Importante: La demo di MQL5.com funziona nel Strategy Tester e potrebbe non riflettere completamente le funzionalità di Enigmera. Consulta la descrizione, gli screenshot e il video per maggiori dettagli. Non esitare a inviarmi un messaggio se hai domande! Il codice dell'indicatore è stato completamente riscritto. La versione 3.0 aggiunge nuove funzionalità e corregge i bug accumulati dall'inizio dell'indicatore. Introduzione Questo indicatore e sistema di trading
KT Alpha Hunter Arrows MT4
KEENBASE SOFTWARE SOLUTIONS
La maggior parte degli indicatori a frecce ti dà un segnale e poi ti lascia capire da solo tutto il resto. KT Alpha Hunter Arrows ti offre un piano di trading completo. Ogni freccia di segnale viene visualizzata con un piano già tracciato: linea di ingresso, stop loss, quattro livelli di take profit e un verdetto edge in tempo reale che ti indica se quel simbolo e quel timeframe meritano di essere tradati in quel momento. Il pacchetto include un Trade Manager EA che gestisce l’esecuzione dopo il
Neo Wave PRO
Nikolay Raykov
5 (1)
Price & Time Market Structure Indicator A professional market structure tool that analyzes waves through both price and time — not price alone. Main Description NeoWave PRO is a professional market structure indicator for MetaTrader 4 designed for traders who want to move beyond traditional one-dimensional wave tools such as ZigZag, swing indicators, and basic high/low systems. Most wave indicators analyze only one thing: Price. But a real market wave is not only a price movement. A true wave de
PRO Renko System
Oleg Rodin
5 (30)
PRO Renko System è un sistema di trading altamente accurato appositamente progettato per il trading di grafici RENKO. Questo è un sistema universale che può essere applicato a vari strumenti di trading. Il sistema neutralizza efficacemente il cosiddetto rumore di mercato che consente di accedere a segnali di inversione accurati. L'indicatore è molto facile da usare e ha un solo parametro responsabile della generazione del segnale. Puoi facilmente adattare lo strumento a qualsiasi strumento di
Trend Lines PRO
Roman Podpora
5 (1)
LINEE DI TENDENZA PRO       Aiuta a capire dove il mercato sta realmente cambiando direzione. L'indicatore mostra reali inversioni di tendenza e punti in cui i principali attori rientrano. Vedi  Linee BOS   Cambiamenti di tendenza e livelli chiave su timeframe più ampi, senza impostazioni complesse o rumore inutile. I segnali non vengono ridisegnati e rimangono sul grafico dopo la chiusura della barra. VERSIONE MT 5     -      Svela il suo massimo potenziale se abbinato all'indicatore   RFI LEVE
Trend Catcher ind
Ramil Minniakhmetov
5 (2)
INDICATORE TREND CATCHER L'indicatore Trend Catcher analizza i movimenti dei prezzi di mercato, utilizzando una combinazione di indicatori di analisi del trend proprietari dell'autore e personalizzati. Identifica la vera direzione del mercato filtrando il rumore a breve termine e concentrandosi sulla forza del momentum sottostante, sull'espansione della volatilità e sul comportamento della struttura dei prezzi. Utilizza inoltre una combinazione di indicatori personalizzati di smoothing e filtr
Genesis Matrix Pro is a professional multi-timeframe trend detection indicator designed to help traders identify high-quality market alignment with clarity and structure. It combines 12 different technical indicators into one visual alignment matrix, allowing traders to quickly see when market conditions are bullish, bearish, or neutral. A signal is generated only when the selected strategies are aligned, helping reduce noise and improve decision-making. PLEASE CONTACT ME AFTER PURCHASE TO GET
Current event:  https://c.mql5.com/1/326/A2SR2025_NoMusic.gif R. Cos'è l'A2SR ?   * È un indicatore tecnico leader (nessuna riverniciatura, nessun ritardo). -- Guida : -- su https://www.mql5.com/en/blogs/post/734748/page4#comment_16532516 -- e https://www.mql5.com/en/users/yohana/blog A2SR ha una tecnica speciale per determinare i livelli di supporto (domanda) e resistenza (offerta). A differenza del modo ordinario che abbiamo visto in rete, A2SR ha un concetto originale nel determinare i li
PZ Trend Trading
PZ TRADING SLU
4.8 (5)
Capture every opportunity: your go-to indicator for profitable trend trading Trend Trading is an indicator designed to profit as much as possible from trends taking place in the market, by timing pullbacks and breakouts. It finds trading opportunities by analyzing what the price is doing during established trends. [ Installation Guide | Update Guide | Troubleshooting | FAQ | All Products ] Trade financial markets with confidence and efficiency Profit from established trends without getting whips
Step into the world of Forex trading with confidence, clarity, and precision using   Gold Indicator   a next-generation tool engineered to take your trading performance to the next level. Whether you’re a seasoned professional or just beginning your journey in the currency markets, Gold Indicator equips you with powerful insights and help you trade smarter, not harder. Built on the proven synergy of three advanced indicators, Gold Indicator focuses exclusively on medium and long-term trends eli
Questo prodotto è stato aggiornato per il mercato 2026 e ottimizzato per le ultime build di MT5. AVVISO DI AGGIORNAMENTO PREZZO: Smart Trend Trading System è attualmente disponibile a $99 . Il prezzo aumenterà a $199 dopo i prossimi 30 acquisti . OFFERTA SPECIALE: Dopo aver acquistato Smart Trend Trading System, inviami un messaggio privato per ricevere Smart Universal EA GRATIS e trasformare i tuoi segnali Smart Trend in operazioni automatiche. Smart Trend Trading System è un sistema di tradin
Scalper Vault
Oleg Rodin
5 (37)
Scalper Vault è un sistema di scalping professionale che ti fornisce tutto il necessario per scalping di successo. Questo indicatore è un sistema di trading completo che può essere utilizzato dai trader di forex e opzioni binarie. L'intervallo di tempo consigliato è M5. Il sistema fornisce segnali di freccia accurati nella direzione della tendenza. Ti fornisce anche i segnali più alti e più bassi e i livelli di mercato di Gann. Gli indicatori forniscono tutti i tipi di avvisi, comprese le notifi
PZ Swing Trading
PZ TRADING SLU
5 (3)
Protect against whipsaws: revolutionize your swing trading approach Swing Trading is the first indicator designed to detect swings in the direction of the trend and possible reversal swings. It uses the baseline swing trading approach, widely described in trading literature. The indicator studies several price and time vectors to track the aggregate trend direction and detects situations in which the market is oversold or overbought and ready to correct. [ Installation Guide | Update Guide | Tro
BTMM State Engine Pro is a MetaTrader 4 indicator for traders who use the Beat The Market Maker approach: Asian session context, kill zone timing, level progression, peak formation detection, and a multi-pair scanner from a single chart. It combines cycle state logic with a built-in scanner dashboard so you do not need the same tool on many charts at once. What it does Draws the Asian session range; session times can follow broker server offset or be set in inputs. Tracks level progression (L
L'indicatore " Dynamic Scalper System " è progettato per il metodo di scalping, ovvero per il trading all'interno di onde di trend. Testato sulle principali coppie di valute e sull'oro, è compatibile con altri strumenti di trading. Fornisce segnali per l'apertura di posizioni a breve termine lungo il trend, con ulteriore supporto al movimento dei prezzi. Il principio dell'indicatore. Le frecce grandi determinano la direzione del trend. Un algoritmo per generare segnali per lo scalping sotto fo
MonsterDash Harmonic Indicator is a harmonic pattern dashboard. It recognizes all major patterns. MonsterDash is a dashboard that displays all detected patterns for all symbols and (almost) all timeframes in sortable and scrollable format. Users can add their own user defined patterns . MonsterDash can open and update charts with the pattern found. Settings MonsterDash's default settings are good enough most of the time. Feel free to fine tune them to your needs. The color settings are for thos
Apollo SR Master è un indicatore di Supporto/Resistenza con caratteristiche speciali che rendono il trading con le zone di Supporto/Resistenza più semplice e affidabile. L'indicatore calcola le zone di Supporto/Resistenza in tempo reale senza alcun ritardo, rilevando i massimi e i minimi dei prezzi locali. Quindi, per confermare la nuova area SR formata, l'indicatore mostra un segnale speciale che segnala che la zona SR può essere presa in considerazione e utilizzata come un vero e proprio segna
Il rilevatore di terremoti del mercato  del sismografo. Description in English : https://www.mql5.com/en/market/product/113869?source=Site+Market+Product+Page#description How to use the Seismograph : https://www.mql5.com/en/market/product/113869#!tab=comments&page=2&comment=52806941 Create an EA : https://www.mql5.com/en/market/product/113869#!tab=comments&page=3&comment=52816509 Qualunque sia il modo in cui fai trading, vuoi assolutamente evitare di entrare nel mercato a bassa liquidità.
ATTUALMENTE SCONTATO DEL 40% La soluzione migliore per ogni principiante o trader esperto! Questo indicatore è uno strumento di trading unico, di alta qualità e conveniente perché abbiamo incorporato una serie di caratteristiche proprietarie e una nuova formula. Con un solo grafico è possibile leggere la forza delle valute per 28 coppie Forex! Immaginate come migliorerà il vostro trading perché sarete in grado di individuare l'esatto punto di innesco di una nuova tendenza o di un'opportunità
Auto Optimized Parabolic RSI: Motore di Momentum 3D Avanzato La maggior parte degli indicatori per trader privati fallisce perché si affida a parametri statici che smettono di funzionare nel momento in cui la volatilità del mercato cambia. Auto Optimized Parabolic RSI risolve il problema dell'"obsolescenza dell'indicatore" ricalcolando continuamente il proprio vantaggio matematico, portando un adattamento quantitativo di livello istituzionale direttamente sul tuo terminale MT5. Il Vantaggio Prin
Advanced Supply Demand
Bernhard Schweigert
4.91 (300)
Speciale Trading- SCONTO DEL 40% La soluzione migliore per qualsiasi trader principiante o esperto! Questo indicatore è uno strumento di trading unico, di alta qualità e conveniente, perché abbiamo incorporato una serie di funzionalità proprietarie e una nuova formula. Con questo aggiornamento, potrai visualizzare doppie zone di timeframe. Non solo potrai visualizzare un TF più alto, ma anche entrambi, il TF del grafico e il TF più alto: MOSTRA ZONE ANNIDATE. Tutti i trader che operano con Of
Questo indicatore funziona con la teoria delle onde di Elliott in due modi: Modalità automatica: In questa modalità, l'indicatore rileverà automaticamente le cinque onde motrici sul grafico in conformità alla teoria delle onde di Elliott. Fornirà previsioni e individuerà potenziali zone di inversione. Inoltre, avrà la capacità di generare avvisi e messaggi push per informare i trader sugli sviluppi importanti. Questa funzionalità automatica semplifica il processo di identificazione e analisi dei
Introduction to Fractal Pattern Scanner Fractal Indicator refers to the technical indicator that makes use of the fractal geometry found in the financial market. Fractal Pattern Scanner is the advanced Fractal Indicator that brings the latest trading technology after the extensive research and development work in the fractal geometry in the financial market. The most important feature in Fractal Pattern Scanner is the ability to measure the turning point probability as well as the trend probabi
Bull versus Bear
Mohamed Hassan
4.5 (18)
Send us a message after your purchase to receive more information on how to get your  BONUS  for FREE  that works in great combination with Bull vs Bear ! Bull versus Bear is an easy-to-use Forex indicator that gives traders clear and accurate signals based on clear trend retests . Forget about lagging indicators or staring at charts for hours because  Bull vs Bear provides real-time entries with no lag and no repaint, so you can trade with confidence. Bull vs Bear  helps you enter trades during
The Propfolio Master Suite is the ultimate all-in-one analytical workstation for professional traders. Combining the power of the Beat The Market Maker (BTMM) methodology, Smart Money Concepts (SND/Liquidity), and Advanced Volume Profile, this suite replaces multiple different indicators with one optimized engine. Monitor up to 14 pairs simultaneously from a single chart, instantly identify market cycles, and seamlessly map institutional footprints with the click of a button. The Command Center
Altri dall’autore
SpectorChart
Sergii Krasnyi
Questo indicatore modifica continuamente il colore dei bordi e dei corpi delle candele, nonché il colore dei volumi in tempo reale. L'indicatore è facile da usare. La tavolozza dei colori è varia. Questo prodotto è una soluzione grafica, quindi è difficile descrivere ciò che fa tramite testo, è più facile vederlo scaricandolo, inoltre il prodotto è gratuito. L'indicatore è adatto ai blogger che vogliono creare una bella immagine di un grafico per l'editing video o ai trader che vogliono rendere
FREE
Questo indicatore semplifica il processo di creazione dei modelli di grafico, consentendo di salvare le impostazioni correnti del grafico in un modello con un solo clic su un pulsante. L'indicatore aggiunge un pulsante direttamente sul grafico che salva automaticamente il modello con un determinato nome e prefisso, facilitando l'organizzazione e l'utilizzo dei modelli. Le funzioni principali dell'indicatore sono: Creazione di un modello del grafico corrente con un solo clic sul pulsante. Poss
FREE
ZoomChart
Sergii Krasnyi
The ZoomChart indicator displays data from other timeframes on the current chart in the subwindow, acting as a magnifying glass or, conversely, shrinking the chart to display larger timeframes. The ZoomChar indicator automatically tracks the current outermost bar on the chart and moves with the chart as it shifts. The indicator can display data from another financial instrument, not limited to the main chart instrument. The robot carries the function of “mirroring” - The ability to convert c
FREE
Questo indicatore è stato progettato per la creazione comoda e veloce di screenshot dei grafici nel terminale di trading. Semplifica notevolmente il processo di salvataggio dei grafici in una determinata directory, fornendo una comoda interfaccia con un pulsante sul grafico, che si attiva con un solo clic. Le funzioni principali dell'indicatore sono: Creazione automatica di uno screenshot del grafico quando viene premuto il pulsante. Possibilità di selezionare una directory per il salvataggio
FREE
TickChartOscillator è un indicatore che visualizza un grafico a tick di un simbolo nella sottofinestra dell'oscillatore. Offre impostazioni flessibili per la personalizzazione: - La possibilità di disabilitare la visualizzazione della linea del prezzo nell'oscillatore. - La possibilità di specificare un simbolo diverso da cui trasmettere il grafico tick. Se il parametro "Symbol" viene lasciato vuoto, il grafico a tick verrà visualizzato per il simbolo corrente su cui è impostato l'indicator
FREE
ChartOverlay
Sergii Krasnyi
ChartOverlay indicator has two main functions 1. mirroring - i.e. for example, it will make USDEUR from EURUSD 2. displaying the price chart of the selected financial instrument (with selected period)  in the subwindow of the main chart. This tool allows traders to easily analyze the relationship between different currency pairs and assets, offering unique customization and visualization features. Key Features: Price Chart Display: The indicator displays the price chart of the selected instrume
FREE
SpreadChartOscillator è un indicatore che visualizza la spread line del simbolo nella sottofinestra dell'oscillatore. Nei parametri è possibile specificare un altro simbolo da cui verrà trasmessa la spread line. Se il parametro "Symbol" viene lasciato vuoto, la spread line verrà visualizzata dal simbolo corrente su cui è impostato l'indicatore. Questo strumento è ideale per i trader che desiderano vedere la dinamica dello spread nel formato dell'oscillatore e utilizzarlo per proteggersi dall'in
FREE
ZoomChart2
Sergii Krasnyi
L'indicatore ZoomChart funziona con due grafici: quello corrente su cui viene lanciato e quello successivo. L'indicatore traduce il secondo grafico nel momento in cui si trova il primo. In questo modo, il secondo grafico rappresenta la stessa situazione del primo grafico (in cui viene lanciato l'indicatore), ma su un arco temporale diverso. In altre parole, questo indicatore funge da lente di ingrandimento o, al contrario, riduce il grafico per visualizzare la situazione su un arco temporale pi
FREE
Filtro:
Ma Siou
45
Ma Siou 2025.01.10 11:39 
 

L'utente non ha lasciato alcun commento sulla valutazione.

Sergii Krasnyi
2725
Risposta dello sviluppatore Sergii Krasnyi 2025.01.10 11:56
Thank you so much for your kind words! We truly appreciate knowing that you’re satisfied with our work. Feedback like this inspires us to do even better. We look forward to working with you again!
Maxim Bazuev
321
Maxim Bazuev 2024.09.20 08:45 
 

L'utente non ha lasciato alcun commento sulla valutazione.

Sergii Krasnyi
2725
Risposta dello sviluppatore Sergii Krasnyi 2025.01.10 11:54
Благодарю Вас за отзыв.
rodnaya
236
rodnaya 2024.08.20 11:53 
 

L'utente non ha lasciato alcun commento sulla valutazione.

Sergii Krasnyi
2725
Risposta dello sviluppatore Sergii Krasnyi 2024.08.20 12:44
Спасибо за отзыв). Мне очень приятно)
Abraham Correa
4658
Abraham Correa 2024.06.23 05:52 
 

Straight up respect for the upload of the indicator.

Sergii Krasnyi
2725
Risposta dello sviluppatore Sergii Krasnyi 2024.06.26 11:06
Thank you for the review, Abraham. It's my pleasure.
Rispondi alla recensione