UPD1 Rsi Dots Dashboard
- Indicatori
-
Vitaliy Kuznetsov
 UPD1 MT4 Indicators - https://www.mql5.com/en/market/mt4/indicator?filter=UPD1
Levels
Patterns
Volume
Money Management - Versione: 3.52
- Aggiornato: 1 gennaio 2025
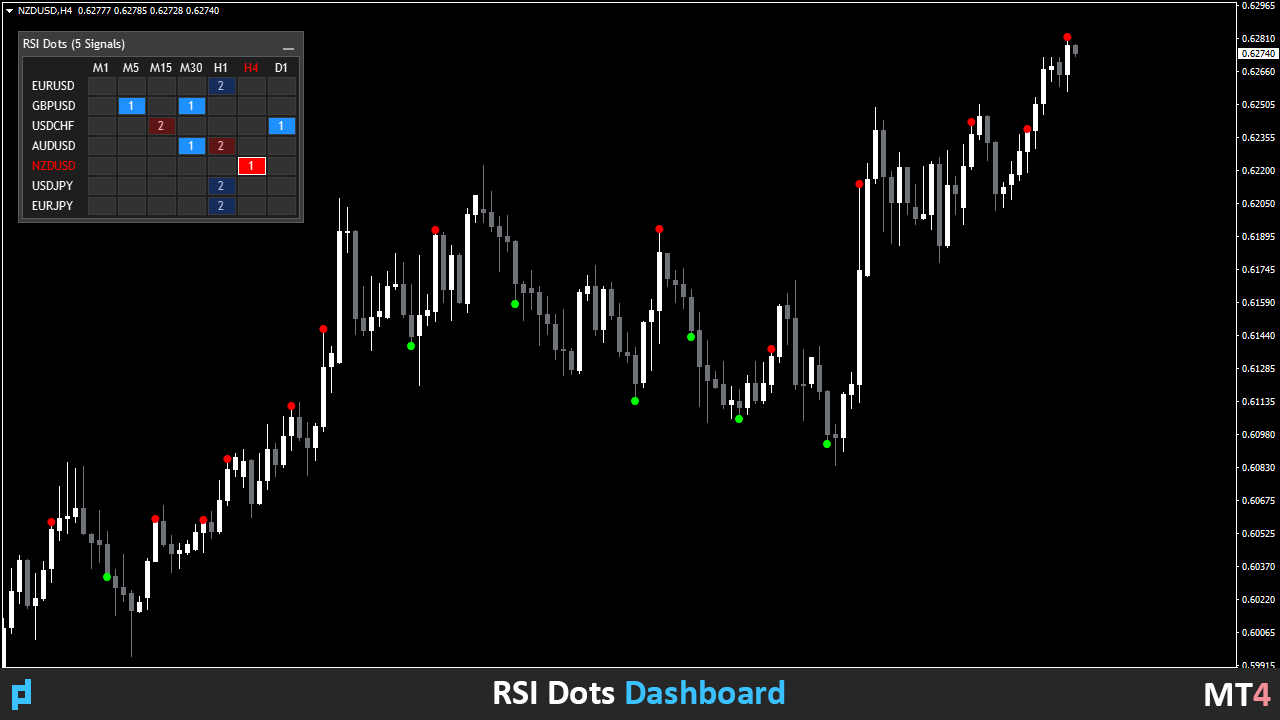
L'indicatore mostra segnali basati sull'oscillatore RSI terminale sul grafico. È possibile filtrare i segnali ripetuti.
Qui l'oscillatore viene utilizzato per cercare un segnale inverso. È raccomandato come punto di ingresso nelle strategie swing e nel trading dai livelli.
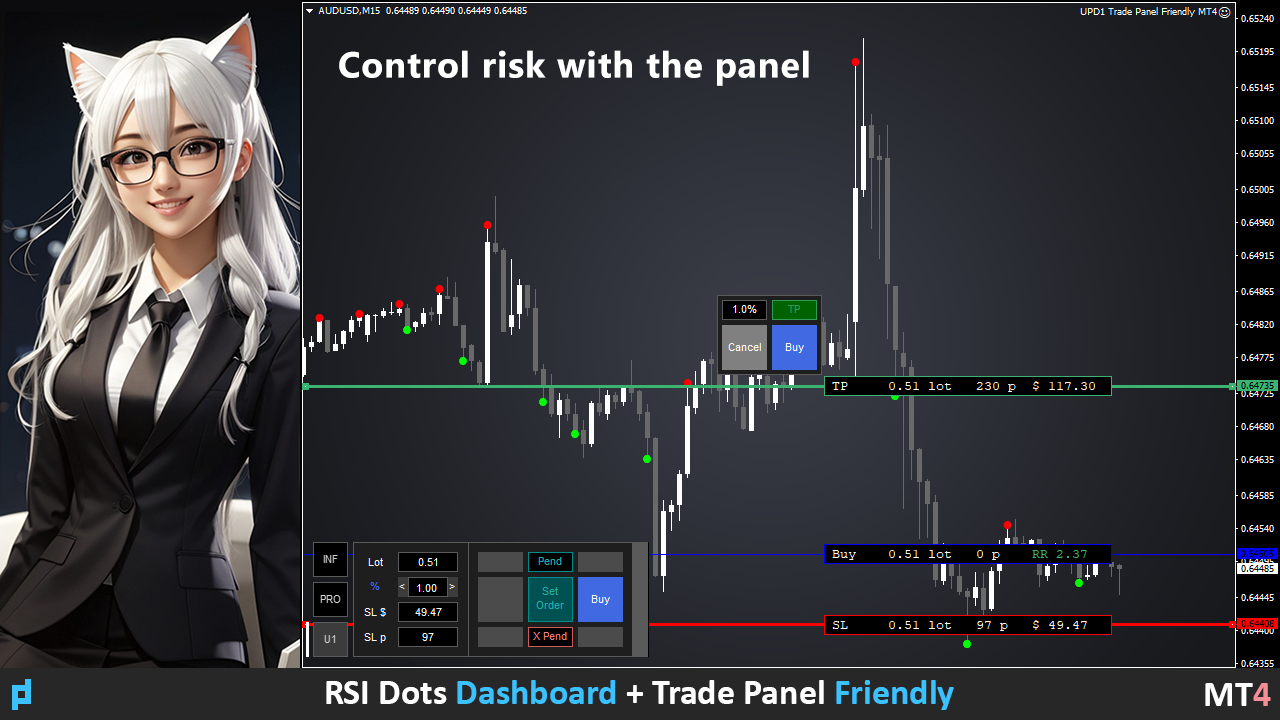
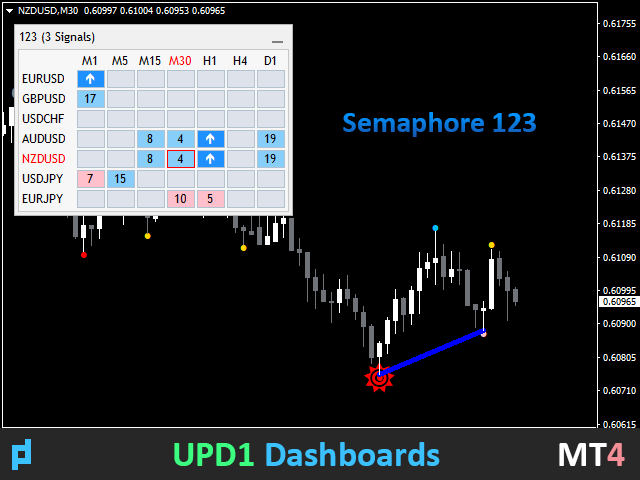
È disponibile una dashboard multi-valuta. Con esso, puoi facilmente passare da un grafico all'altro.
Nelle discussioni sui prodotti, è possibile suggerire un algoritmo in cui è possibile incorporare un dashboard.
Parametri di input.
Impostazioni principali.
Bars Count – il numero di barre di cronologia su cui funzionerà l'indicatore.
RSI Period – periodo dell'oscillatore.
RSI Level – il livello dell'oscillatore. L'oscillatore va tra 0 e 100. Se si seleziona 10, il segnale sarà superiore a 10 e inferiore a 90.
RSI Applied Price.
Repeat Signal - Segnale di ripetizione.
Enable – tutti i segnali ripetuti saranno con frecce / icone.
No Signal – tutti quelli ripetuti saranno ignorati.
Frecce visive.
Sell Code – il numero di codice dell'icona Sell RSI.
Sell Color – il colore dell'icona Sell RSI.
Buy Code – il numero di codice dell'icona Acquista RSI.
Buy Color – il colore dell'icona Acquista RSI.
Indent Coeff – rientro dall'ombra per il coefficiente di volatilità.
Size – dimensione icona.
Impostazioni del cruscotto.
Dashboard - attiva/disattiva il dashboard multi-valuta multi-timeframe.
Scan Bars - quante barre nella storia monitorare dopo la fine del segnale (default è 2, ci sono 5, 10, 20, 30).
Dashboard Zoom % (0 -auto) - zoom visivo del cruscotto.
Color Theme - selezione automatica o manuale del tema colore del pannello (chiaro e scuro).
Symbol Lyst - elenco dei simboli. Puoi inserire qualsiasi strumento separato da virgole.
View M1-MN - attiva/disattiva un intervallo di tempo specifico.
Impostazioni degli avvisi.
Alert - attiva / disattiva avviso.
Current Chart – avviso solo sul grafico corrente, ignorando i segnali del cruscotto.
Dashboard List – avviso quando compaiono nuovi segnali nel cruscotto.
Alert Work Time - periodo di tempo in cui l'allarme funzionerà.
Alert Pop Up - abilita / disabilita il popup di avviso.
Alert Push - Abilita / Disabilita l'avviso sul telefono.
Alert E-mail - Abilita / Disabilita l'invio di avvisi e-mail.
Alert Sound - Abilita / Disabilita l'allarme.
Alert Sound Name - nome del file audio.


great indicator, these all well designed and works perfectly