Zig Zag 123
- Indicatori
- Versione: 1.3
- Aggiornato: 30 aprile 2019

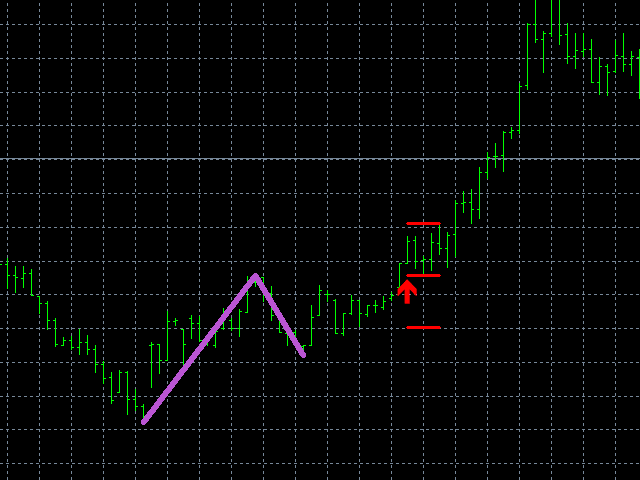
Zig Zag 123 tells us when a reversal or continuation is more likely by looking at the shift in supply and demand. When this happens a signature pattern appears known as 123 (also known ABC) will often break out in direction of higher low or lower high.
Stop loss and take profit levels have been added. There is a panel that shows the overall performance of your trades for if you was to use these stop loss and take profit levels.
We get alerted if a pattern 123 appears and also if the price reaches our stop loss or take profit levels as set by user inputs.
Features :
- An effective way of recognising when a move is about to happen
- Choose your favourite signal color
- Send alerts to either your PC, eMail or mobile device
- Works on any timeframe
- No repainting or other such exaggerated claims
Settings :
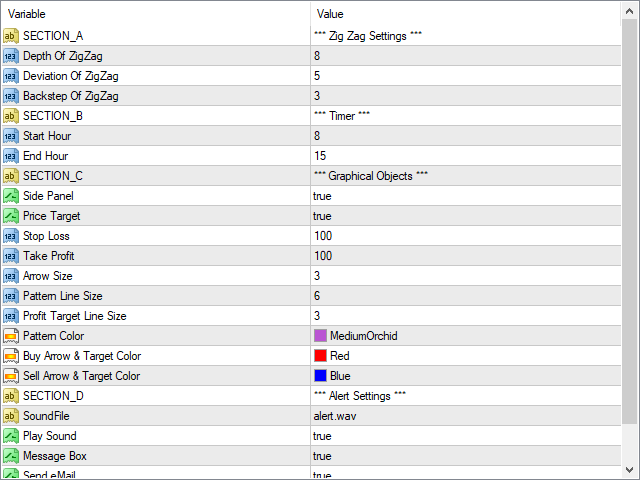
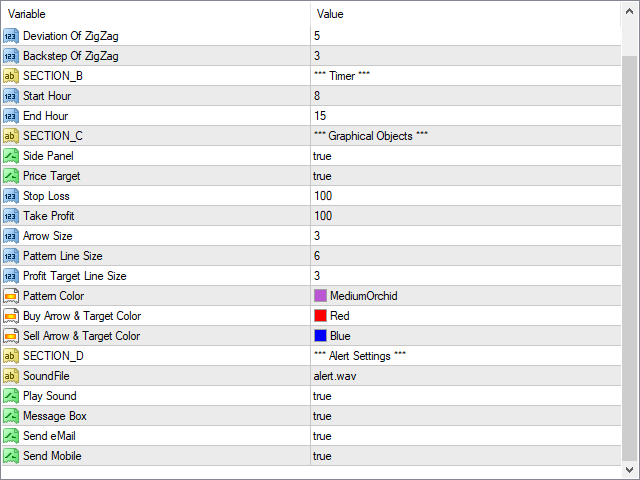
ZigZag Settings
- Depth Of ZigZag - Depth of ZigZag
- Deviation - Deviation of ZigZag
- Backstep - Backstep of ZigZag
Start Hour End Hour
- Start Hour - We only allow signal after this start hour
- End Hour - We only allow signal before this ending hour
Graphical Object Settings
- Side Panel - For if we want the side panel on or off
- Price Target - If we want stop loss and take profit lines to appear or not
- Stop Loss - Sets the stop loss line in points not pips
- Take Profit - Sets the take profit line in points not pips
- Arrow Size - The size of the arrow 1 is smallest
- Pattern Size - Size of lines drawn that outline pattern
- Profit Size - Size of lines drawn that make our stop loss or takep profit levels
- Pattern Color - Color of lines
- Buy Arrow & Target Color - Color of buy arrows
- Sell Arrow & Target Color - Color of sell arrows