Intraday Dashboard MT4
- Indicateurs
- Version: 2.40
- Mise à jour: 17 novembre 2021
- Activations: 5

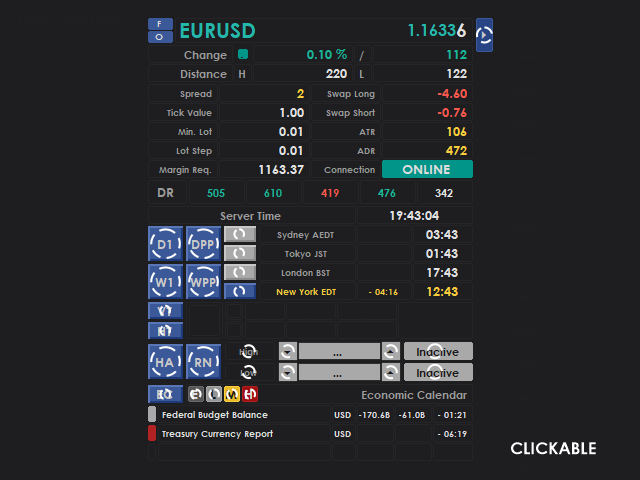
Intraday Dashboard for MetaTrader 4
Intraday Dashboard consists of comprehensive data designed to only be displayed with the toggle button.
A lot of trader don't like messy chart, however it does happen sometimes that trader need to look into data such as session and economic calendar to make a better decision making when trading. This indicator is solution for that particular condition, to provide market information only if needed.
Features
- Separated button for each information
- 90% customizable color
- Precision session time with DST correction
- Symbol Info
- Market Info
- Terminal Info
- Daily Data
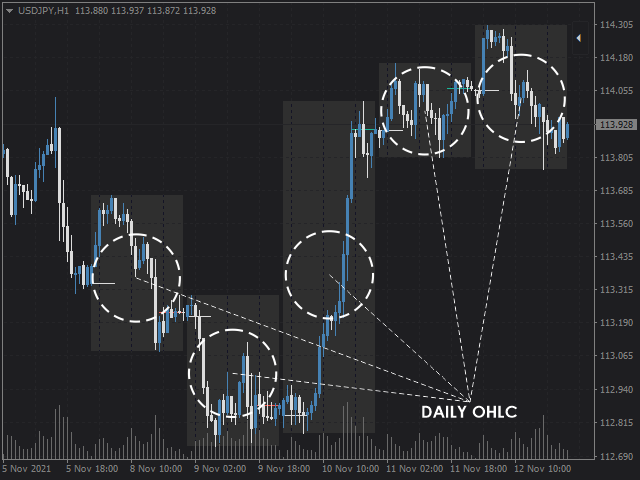
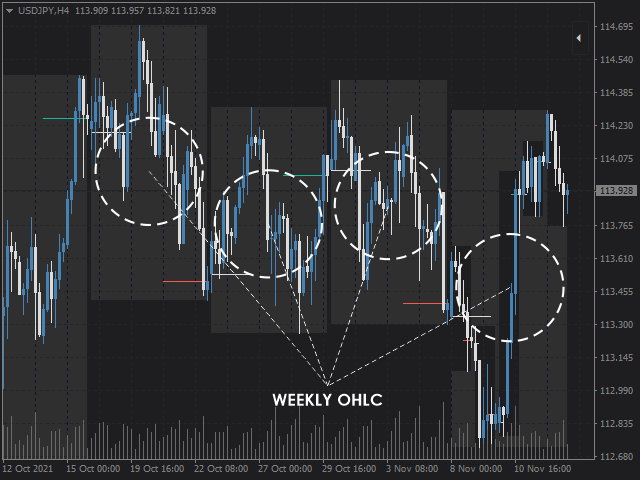
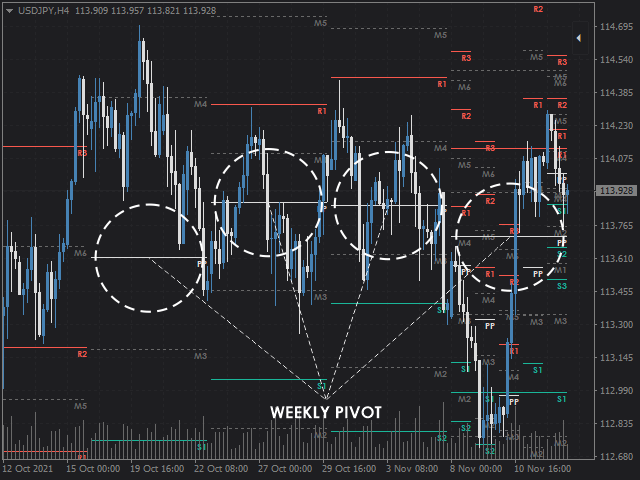
- Daily and Weekly OHLC
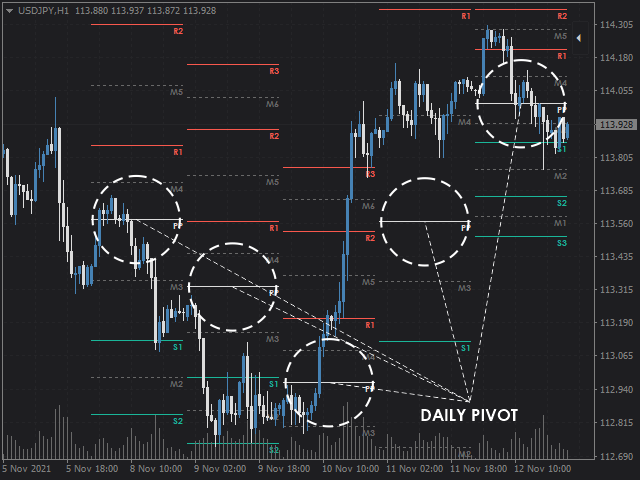
- Daily and Weekly Pivot Point (De Mark, Standard, Woodie, Camarilla, and Fibonacci)
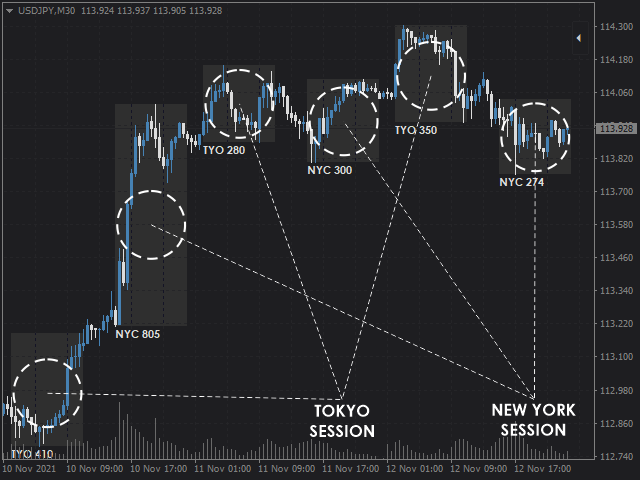
- Session Info (Sydney, Tokyo, London, and New York)
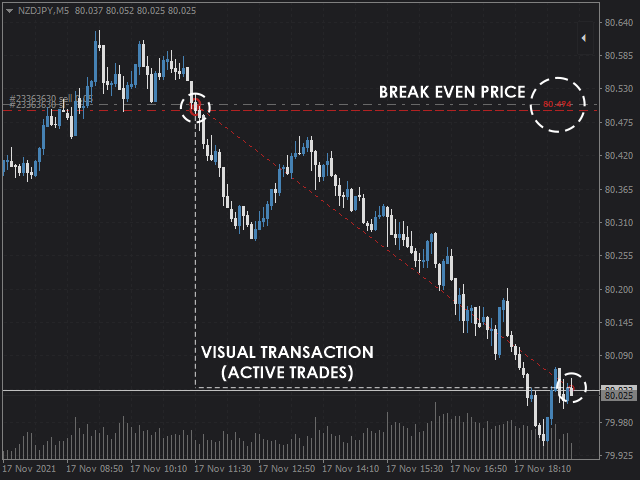
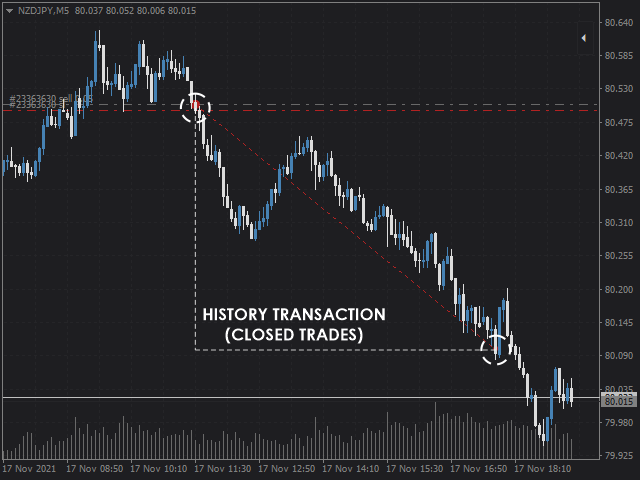
- Position Info (Active and History)
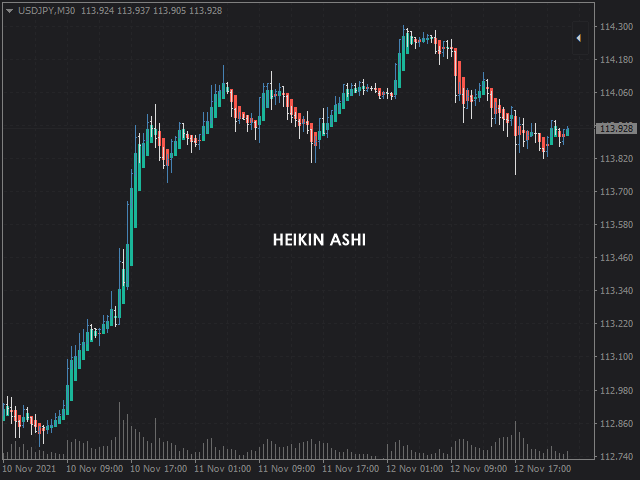
- Indicator Data (ATR, ADR, DR, and Heikin Ashi)
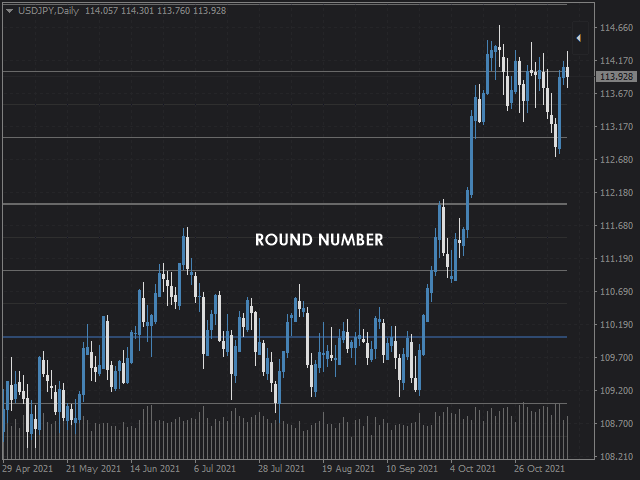
- Round Number
- Price Alert
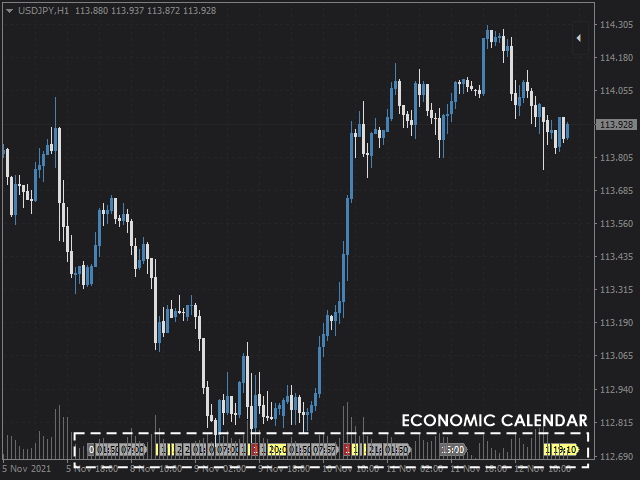
- Economic Calendar
Important
- Indicator was tested on PC with Windows OS.
- Indicator will probably not working properly if you are using Windows Font Scaling (usually laptop user), font modifier available in input parameter specifically to deal with this particular problem, but there is no guarantee that it will work without bug, current graphical user interface in this indicator does not have scaling feature.
- Graphical User Interface dimension 345 x 443 pixel in the top right main window, not suitable for low resolution monitor.
- Century Gothic Bold, Webdings, and Wingdings font need to be installed.
- Additional indicator is needed for economic calendar features (here), install additional indicator only in one chart with dll call enabled. Economic calendar data downloaded from Forex Factory and sometimes it create issue when the website is down, when this happen, simply remove the additional indicator.
- Please PM if you have problem or found any bug.
Session Local Time Specification
- Sydney Session at 7 A.M. to 4 P.M.
- Tokyo Session at 9 A.M. to 6 P.M.
- London Session at 8 A.M. to 5 P.M.
- New York Session at 8 A.M. to 5 P.M.
Daylight Saving Time Specification
- Sydney AEDT UTC+11 (first Sunday in April - first Sunday in October), Sydney AEST UTC+10
- Tokyo JST UTC+09
- London GMT UTC+00 (last Sunday in March - last Sunday in October), London BST UTC+01
- New York EST UTC-05 (second Sunday in March - first Sunday in November), New York EDT UTC-04
- Server Time DST hardcoded in New York DST, PM the author if your broker use another DST specification
Input Parameter
- Unit Type: Choose Unit Type between Point, Pip, Integer, or Digit to be displayed in the dashboard.
- Server UTC Delta: Adjustable UTC Delta for a quick session time fix, most liquidity provider use UTC+02, check session local time in the dashboard to make sure that the time is correct.
- ATR Period: Average True Range Period to be calculate.
- ADR Period: Average Daily Range to be calculate.
- Fractals Size: Fractals Type that will be used for High/Low sequences copy price.
- Vertical Shift: Shift (in pixel) to modify indicator y-coordinate.
- Candlestick Shift: Shift (in current timeframe period) to modify the gap between Daily and Weekly OHLC with the last bar in the chart.
- Draw Period: Period to calculate and draw OHLC, Pivot Point, and Session Range.
- Font Modifier: Font Size modifier for user that use Windows Font Scaling.
- Pivot Point Type: Pivot Point Calculation Type, available between De Mark, Standard, Woodie, Camarilla, and Fibonacci.
- Rectangle Fill: Drawing settings for session range between filled or hollow rectangle.
- Default Chart Mode: Default Chart Mode, choose one that is preferred as in your personal template.
- Heikin Ashi Chart Mode: Chart Mode when Heikin Ashi displayed.
- Round Number Constant: Constant to define round number, adjustable to accommodate all type of market.
- Expiry: Economic Calendar Expiration for latest news to be displayed in the dashboard (in minute).
- Other parameter with color input is customizable color scheme.
- Pop Up, Push Notification, and E-mail is alert settings.
L'utilisateur n'a laissé aucun commentaire sur la note