Intraday Dashboard MT4
- インディケータ
- バージョン: 2.40
- アップデート済み: 17 11月 2021
- アクティベーション: 5

Intraday Dashboard for MetaTrader 4
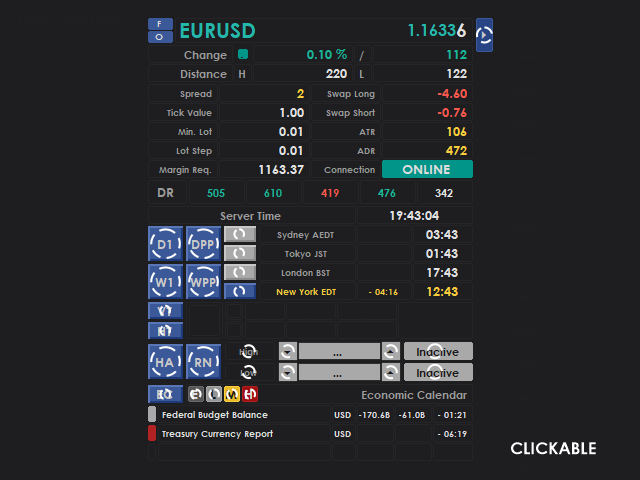
The Intraday Dashboard provides a comprehensive set of market information that can be displayed on demand through a toggle function. Many traders prefer a clean and uncluttered chart to maintain focus during market analysis. However, there are situations where access to additional information—such as trading sessions, economic calendar events, and other market data—is essential for informed decision-making. The Intraday Dashboard addresses this need by allowing users to display relevant market information only when required, preserving chart clarity while ensuring that critical data remains readily accessible.
Features
- Independent toggle controls for each information panel, allowing users to display only the data they require.
- Approximately 90% of interface elements are fully customizable, including color settings.
- Accurate trading session schedules with automatic Daylight Saving Time (DST) adjustment.
- Symbol Info
- Market Info
- Terminal Info
- Daily Market Data
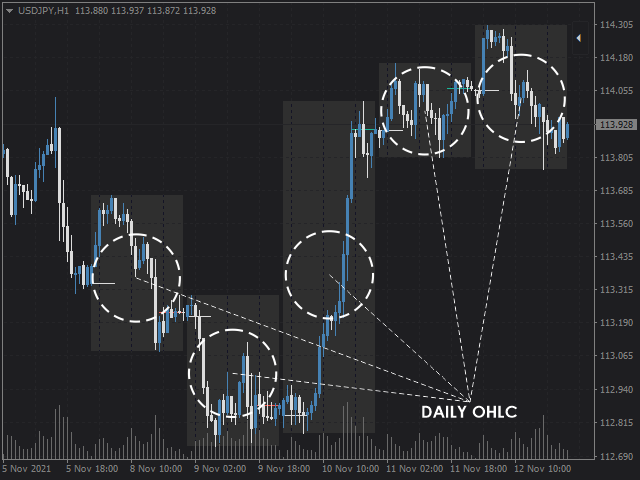
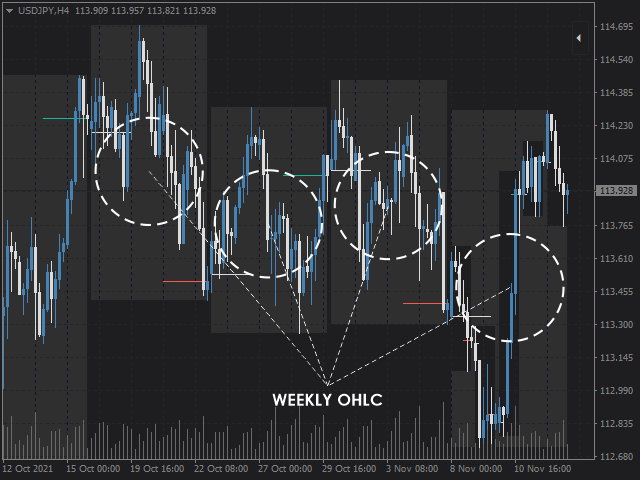
- Daily and Weekly OHLC (Open, High, Low, Close) values.
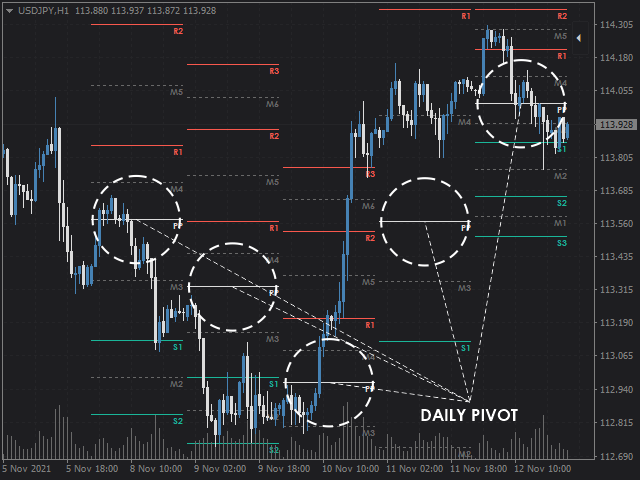
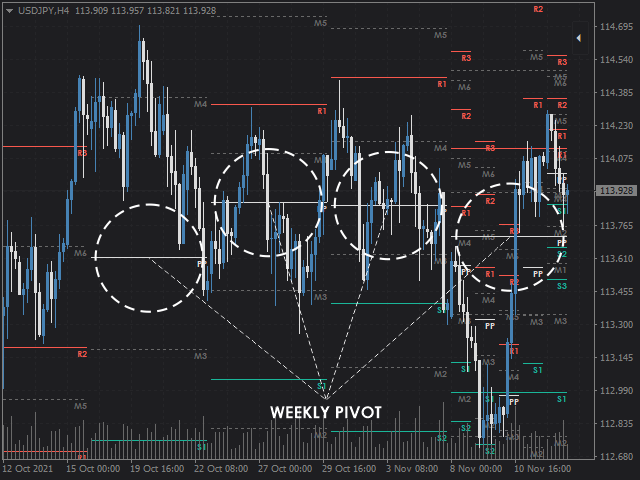
- Daily and Weekly Pivot Points supporting DeMark, Standard, Woodie, Camarilla, and Fibonacci calculation methods.
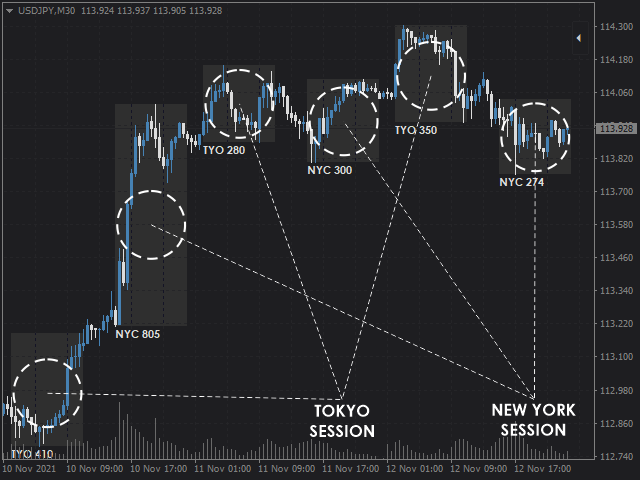
- Trading Session Information for Sydney, Tokyo, London, and New York markets.
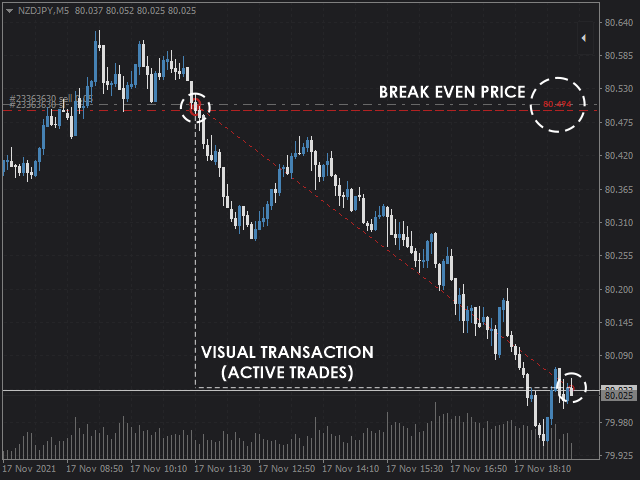
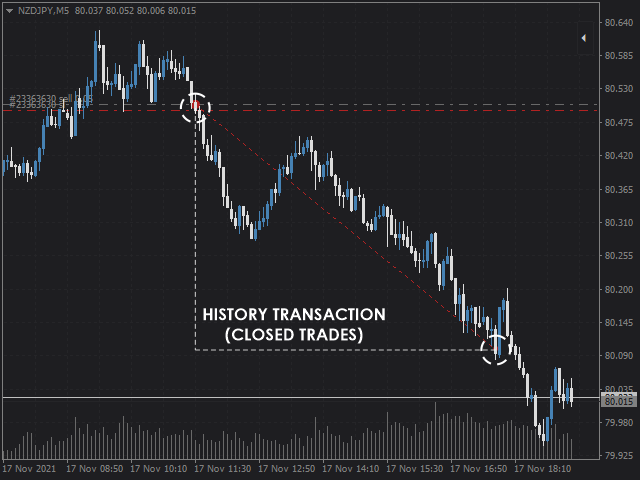
- Position Information, including both active and historical positions.
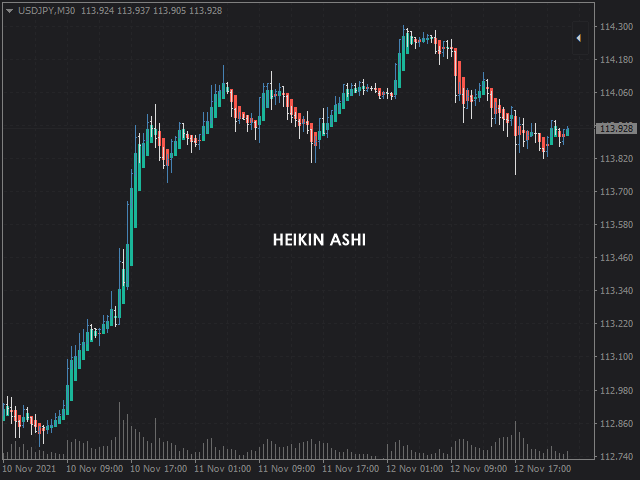
- Integrated Technical Indicator Data, including ATR, ADR, Daily Range (DR), and Heikin Ashi.
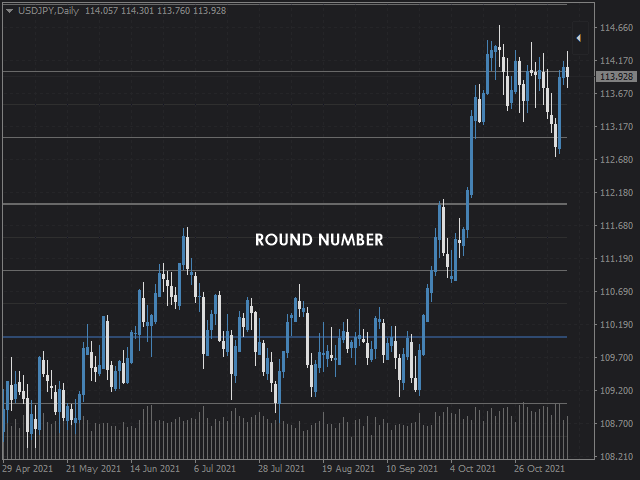
- Round Number level identification.
- Configurable Price Alerts.
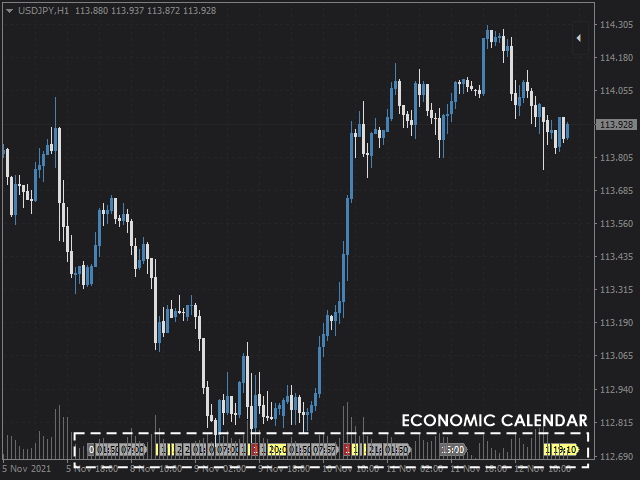
- Integrated Economic Calendar for monitoring scheduled market events.
System Requirements and Important Notes
- This indicator has been tested on PCs running the Windows operating system.
- The graphical user interface (GUI) may NOT display correctly when Windows Display Scaling (Font Scaling) is enabled, a configuration commonly used on high-resolution displays. A font adjustment parameter is provided within the indicator settings to help mitigate this issue; however, compatibility cannot be guaranteed, as the current GUI does not support automatic scaling.
- The primary GUI window occupies approximately 345 × 443 pixels in the upper-right corner of the chart. A display with sufficient screen resolution is recommended to ensure optimal usability.
- The following fonts must be installed on the system for proper display: Century Gothic Bold, Webdings, and Wingdings.
- The Economic Calendar feature requires the installation of an additional companion indicator (here). This companion indicator should be attached to only one chart with DLL imports enabled. Economic calendar data is retrieved from Forex Factory. As the data source is externally maintained, temporary service interruptions or website unavailability may affect functionality. If such issues occur, simply remove the companion indicator until the service is restored.
- If you experience any issues or identify a software defect, please contact the developer with a detailed description of the problem to facilitate investigation.
Session Local Time Specification
- Sydney Session at 7 A.M. to 4 P.M.
- Tokyo Session at 9 A.M. to 6 P.M.
- London Session at 8 A.M. to 5 P.M.
- New York Session at 8 A.M. to 5 P.M.
Daylight Saving Time Specification
- Sydney AEDT UTC+11 (first Sunday in April - first Sunday in October), Sydney AEST UTC+10
- Tokyo JST UTC+09
- London GMT UTC+00 (last Sunday in March - last Sunday in October), London BST UTC+01
- New York EST UTC-05 (second Sunday in March - first Sunday in November), New York EDT UTC-04
- Server Time DST hardcoded in New York DST, PM the author if your broker use another DST specification
Input Parameter
- Unit Type: Choose Unit Type between Point, Pip, Integer, or Digit to be displayed in the dashboard.
- Server UTC Delta: Adjustable UTC Delta for a quick session time fix, most liquidity provider use UTC+02, check session local time in the dashboard to make sure that the time is correct.
- ATR Period: Average True Range Period to be calculate.
- ADR Period: Average Daily Range to be calculate.
- Fractals Size: Fractals Type that will be used for High/Low sequences copy price.
- Vertical Shift: Shift (in pixel) to modify indicator y-coordinate.
- Candlestick Shift: Shift (in current timeframe period) to modify the gap between Daily and Weekly OHLC with the last bar in the chart.
- Draw Period: Period to calculate and draw OHLC, Pivot Point, and Session Range.
- Font Modifier: Font Size modifier for user that use Windows Font Scaling.
- Pivot Point Type: Pivot Point Calculation Type, available between De Mark, Standard, Woodie, Camarilla, and Fibonacci.
- Rectangle Fill: Drawing settings for session range between filled or hollow rectangle.
- Default Chart Mode: Default Chart Mode, choose one that is preferred as in your personal template.
- Heikin Ashi Chart Mode: Chart Mode when Heikin Ashi displayed.
- Round Number Constant: Constant to define round number, adjustable to accommodate all type of market.
- Expiry: Economic Calendar Expiration for latest news to be displayed in the dashboard (in minute).
- Other parameter with color input is customizable color scheme.
- Pop Up, Push Notification, and E-mail is alert settings.
ユーザーは評価に対して何もコメントを残しませんでした