Intraday Dashboard MT4
- Indicadores
- Versión: 2.40
- Actualizado: 17 noviembre 2021
- Activaciones: 5

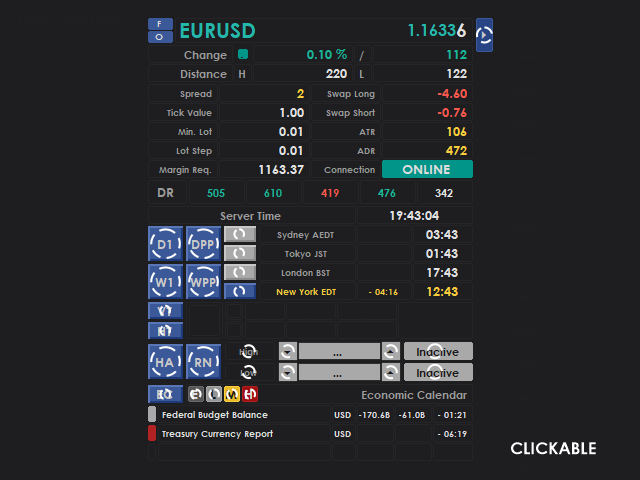
Panel de control intradía para MetaTrader 4
El panel de control intradía ofrece un conjunto completo de información de mercado que se puede mostrar a petición mediante una función de activación. Muchos operadores prefieren un gráfico limpio y despejado para mantener la concentración durante el análisis de mercado. Sin embargo, hay situaciones en las que el acceso a información adicional —como las sesiones de negociación, los eventos del calendario económico y otros datos de mercado— resulta esencial para tomar decisiones con conocimiento de causa. El panel de control intradía responde a esta necesidad al permitir a los usuarios mostrar la información de mercado relevante solo cuando es necesario, preservando la claridad del gráfico y garantizando al mismo tiempo que los datos críticos sigan estando fácilmente accesibles.
Características
- Controles de activación independientes para cada panel de información, lo que permite a los usuarios mostrar únicamente los datos que necesitan.
- Aproximadamente el 90 % de los elementos de la interfaz son totalmente personalizables, incluida la configuración de colores.
- Horarios precisos de las sesiones bursátiles con ajuste automático al horario de verano (DST).
- Información sobre símbolos
- Información del mercado
- Información de la terminal
- Datos diarios del mercado
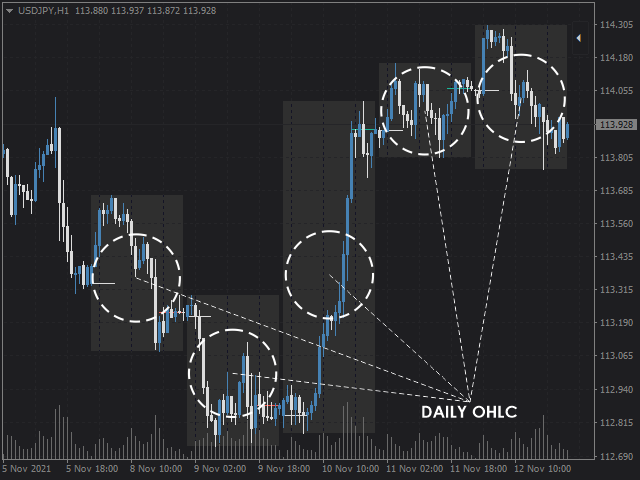
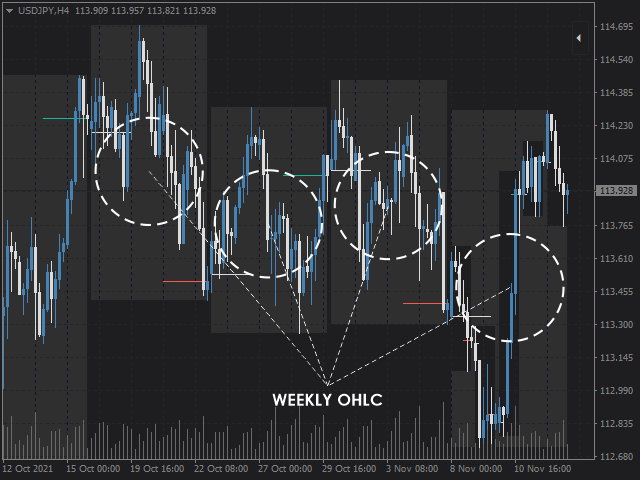
- Valores OHLC (apertura, máximo, mínimo y cierre) diarios y semanales.
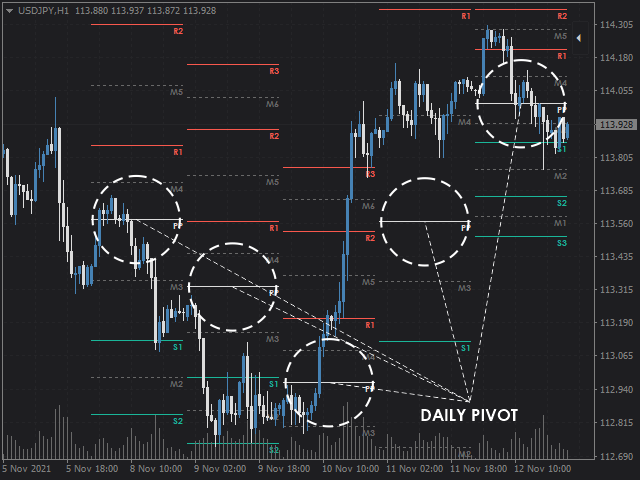
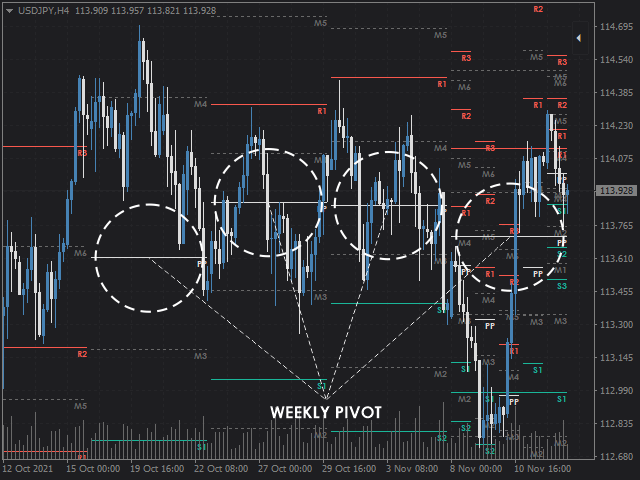
- Puntos de pivote diarios y semanales compatibles con los métodos de cálculo DeMark, Estándar, Woodie, Camarilla y Fibonacci.
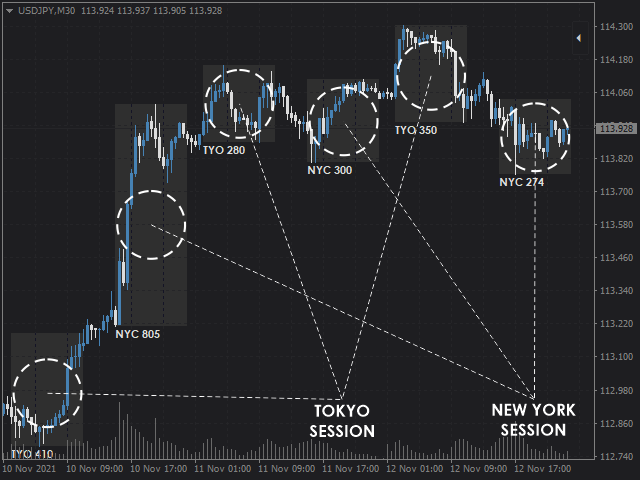
- Información sobre las sesiones de negociación de los mercados de Sídney, Tokio, Londres y Nueva York.
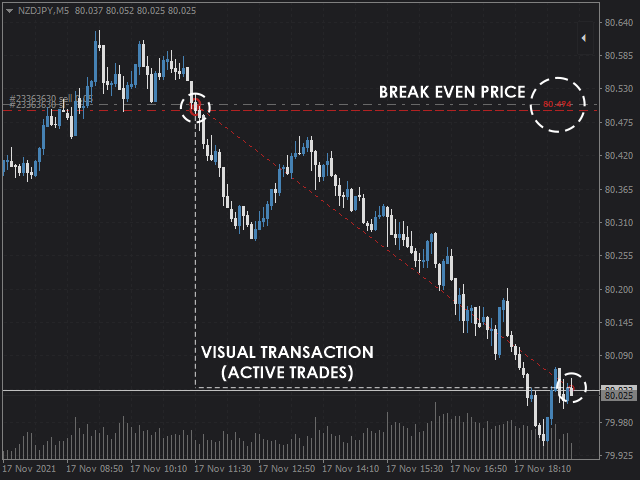
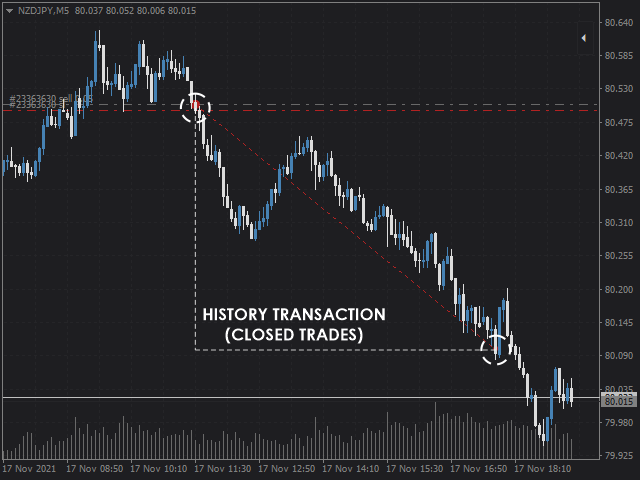
- Información sobre posiciones, incluidas tanto las activas como las históricas.
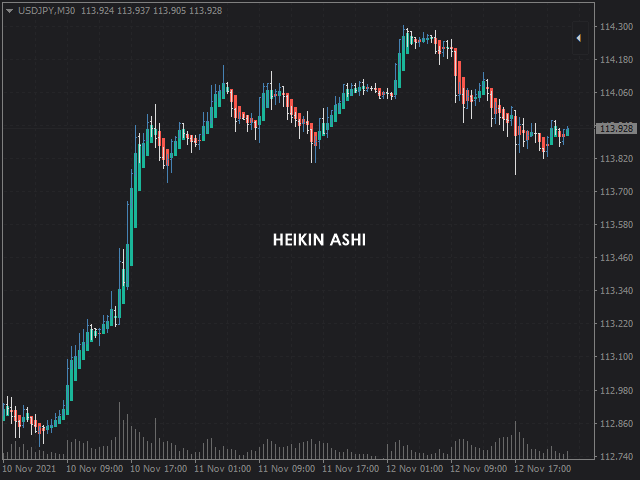
- Datos de indicadorestécnicos integrados , incluyendo ATR, ADR, rango diario (DR) y Heikin Ashi.
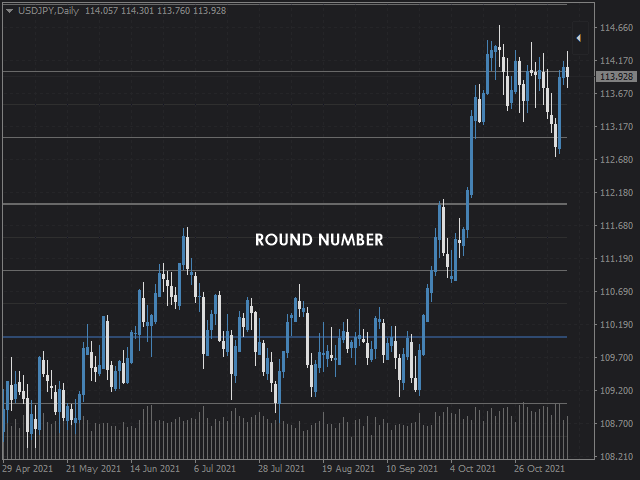
- Identificación de niveles de números redondos.
- Alertasde precios configurables .
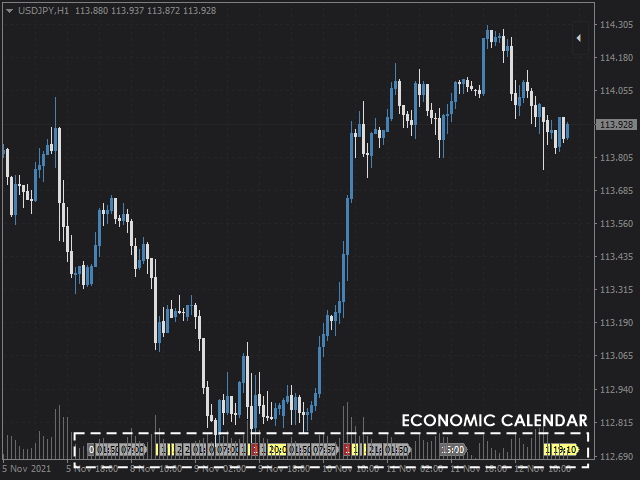
- Calendarioeconómico integrado para el seguimiento de los eventos programados en los mercados.
Requisitos del sistema y notas importantes
- Este indicador se ha probado en ordenadores con el sistema operativo Windows.
- Es posible que la interfaz gráfica de usuario (GUI) NO se muestre correctamente cuando esté activada la función de escalado de pantalla de Windows (escalado de fuentes), una configuración muy habitual en pantallas de alta resolución. En los ajustes del indicador se incluye un parámetro de ajuste de fuentes para ayudar a mitigar este problema; sin embargo, no se puede garantizar la compatibilidad, ya que la GUI actual no admite el escalado automático.
- La ventana principal de la GUI ocupa aproximadamente 345 × 443 píxeles en la esquina superior derecha del gráfico. Se recomienda una pantalla con resolución suficiente para garantizar una usabilidad óptima.
- Para una visualización correcta, deben estar instaladas en el sistema las siguientes fuentes: Century Gothic Bold, Webdings y Wingdings.
- La función «Calendario económico» requiere la instalación de un indicador complementario adicional (aquí). Este indicador complementario debe añadirse a un solo gráfico con las importaciones de DLL habilitadas. Los datos del calendario económico se obtienen de Forex Factory. Dado que la fuente de datos se gestiona externamente, las interrupciones temporales del servicio o la indisponibilidad del sitio web pueden afectar a su funcionamiento. Si se producen estos problemas, basta con eliminar el indicador complementario hasta que se restablezca el servicio.
- Si experimenta algún problema o detecta un defecto en el software, póngase en contacto con el desarrollador con una descripción detallada del problema para facilitar la investigación.
Especificación de la hora local de la sesión
- Sesión de Sídney: de 7:00 a 16:00
- Sesión de Tokio: de 9:00 a 18:00
- Sesión de Londres: de 8:00 a 17:00
- Sesión de Nueva York: de las 8:00 a las 17:00.
Especificación del horario de verano
- Sídney AEDT UTC+11 (del primer domingo de abril al primer domingo de octubre), Sídney AEST UTC+10
- Tokio JST UTC+09
- Londres: GMT (UTC+00) (del último domingo de marzo al último domingo de octubre); Londres: BST (UTC+01)
- Nueva York, EST (UTC-05) (del segundo domingo de marzo al primer domingo de noviembre); Nueva York, EDT (UTC-04)
- La hora del servidor tiene el horario de verano de Nueva York programado de forma fija; envía un mensaje privado al autor si tu bróker utiliza otra configuración de horario de verano
Parámetros de entrada
- Tipo de unidad: elige el tipo de unidad (punto, pip, número entero o dígito) que se mostrará en el panel de control.
- Diferencia UTC del servidor: Diferencia UTC ajustable para una rápida corrección de la hora de la sesión; la mayoría de los proveedores de liquidez utilizan UTC+02; comprueba la hora local de la sesión en el panel de control para asegurarte de que la hora es correcta.
- Período del ATR: período del rango verdadero medio (ATR) que se va a calcular.
- Período del ADR: Rango medio diario que se va a calcular.
- Tamaño de los fractales: Tipo de fractales que se utilizarán para copiar el precio de las secuencias de máximos y mínimos.
- Desplazamiento vertical: Desplazamiento (en píxeles) para modificar la coordenada y del indicador.
- Desplazamiento de velas: Desplazamiento (en el periodo de tiempo actual) para modificar la diferencia entre los precios OHLC diarios y semanales y la última barra del gráfico.
- Período de trazado: Período para calcular y trazar los valores OHLC, el punto de pivote y el rango de la sesión.
- Modificador de fuente: Modificador del tamaño de fuente para usuarios que utilizan el escalado de fuentes de Windows.
- Tipo de punto pivote: Tipo de cálculo del punto pivote, disponible entre De Mark, Estándar, Woodie, Camarilla y Fibonacci.
- Relleno del rectángulo: Ajustes de dibujo para el rango de la sesión, entre rectángulo relleno o hueco.
- Modo de gráfico predeterminado: modo de gráfico predeterminado; elige el que prefieras según tu plantilla personal.
- Modo de gráfico Heikin Ashi: modo de gráfico cuando se muestra Heikin Ashi.
- Constante de redondeo: constante para definir el redondeo, ajustable para adaptarse a todo tipo de mercados.
- Vencimiento: Vencimiento del calendario económico para que se muestren las últimas noticias en el panel de control (en minutos).
- Otros parámetros con opción de color permiten personalizar la combinación de colores.
- Las ventanas emergentes, las notificaciones push y el correo electrónico son ajustes de alertas.
El usuario no ha dejado ningún comentario para su valoración