Paradox M5
- Experts
- Version: 7.0
- Mise à jour: 14 juin 2026
- Activations: 5

Il s'agit d'un Expert Advisor (robot de trading) pour l'or (XAUUSD) qui est généralement tolérant envers les différents courtiers (brokers).
Comment l'utiliser :
-
Attacher au graphique : Appliquez-le au graphique de 5 minutes (M5) de l'XAUUSD.
-
Trailing Stop : L'activation des stops suiveurs (trailing stops) fait passer le taux de réussite (win rate) de 60 % à 70 %, mais réduit le potentiel de profit.
-
Taille de position : Pour utiliser le dimensionnement de position ajusté au spread, vous devez optimiser les paramètres en fonction du flux de données de votre courtier (broker data feed) en utilisant des ticks réels sur une période significative, sinon cela ne fonctionnera pas comme prévu. Les paramètres actuels ont été optimisés avec le flux de données de Vantage. Un dimensionnement de position correctement optimisé réduit considérablement les risques et le drawdown, en particulier pour les flux de données des prop firms (sociétés pour compte propre), mais réduit également le potentiel de profit.
Remarque : En option, vous pouvez désactiver le trading pendant certains régimes de spread. Un régime de forte incertitude est favorable au trading car il reflète une grande prévisibilité du marché et une attitude défensive de la part du courtier.
RÉSUMÉ EXÉCUTIF (Performances globales)
Performances du compte
-
Solde initial : $100.00
-
Solde final : $4,125.63
-
Profit/Perte net(te) : $4,046.29
-
Rendement total : 4,025.63 %
-
Période de trading : 832 jours (du 2024-03-01 au 2026-06-11)
Activité de trading
-
Total des trades : 422
-
Trades gagnants : 273 (64.69 %)
-
Trades perdants : 149 (35.31 %)
-
Trade moyen : $9.59
Répartition par période
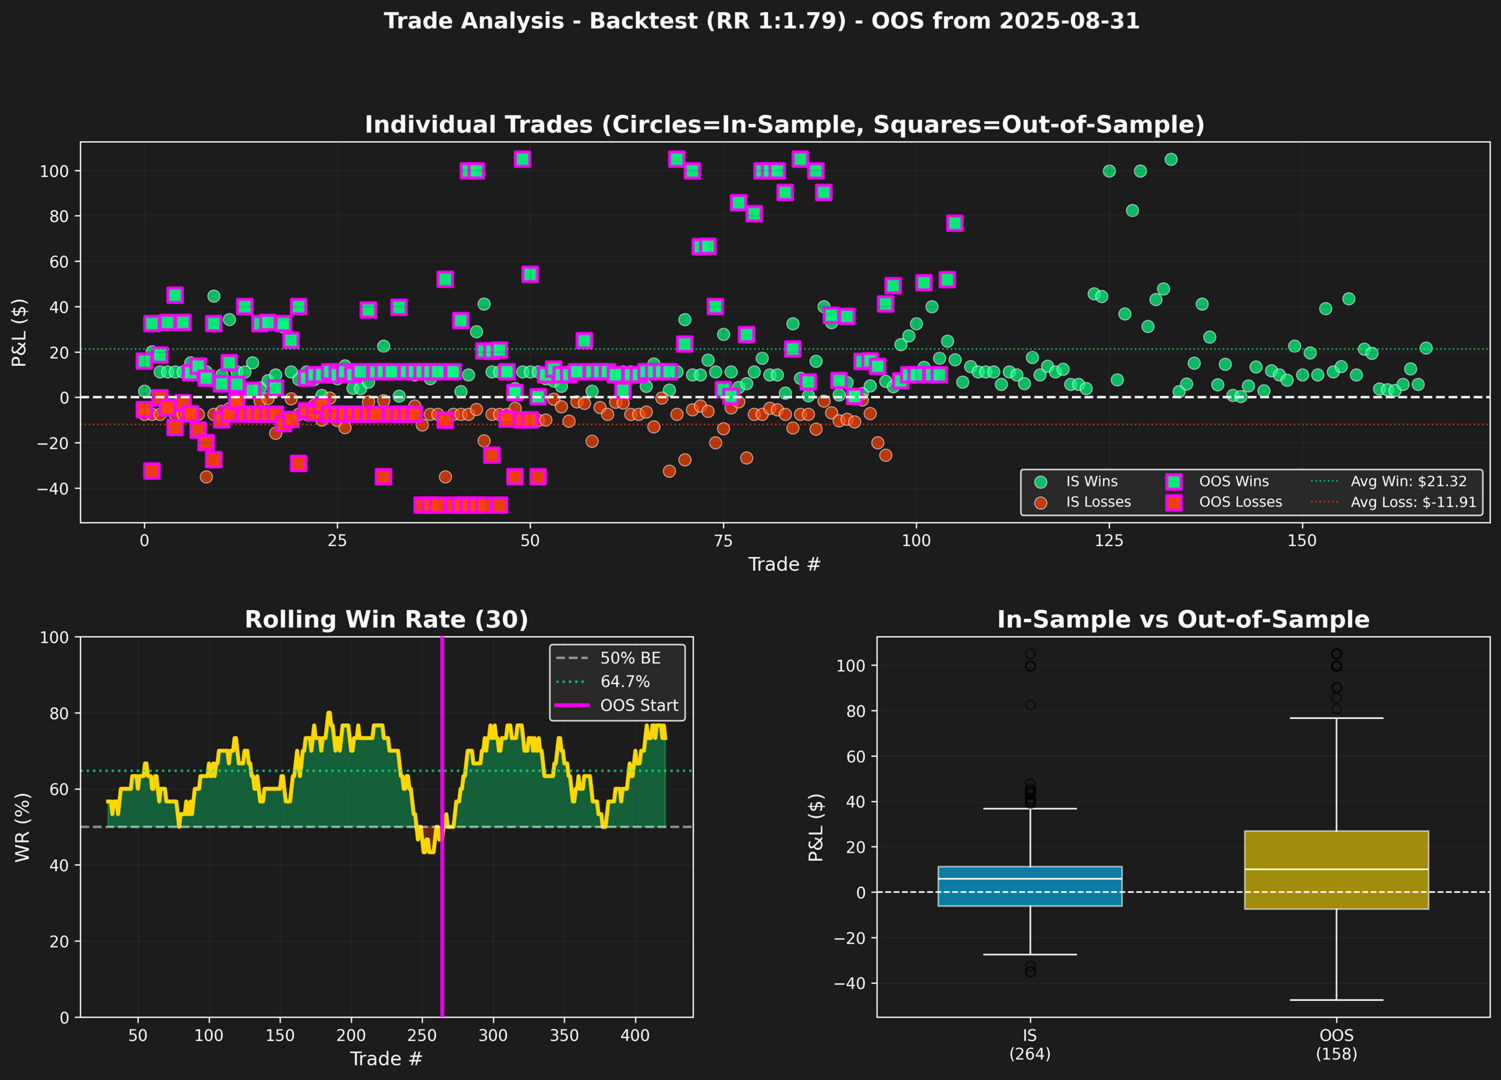
Période "In-Sample" (Dans l'échantillon, avant le 2025-08-31)
-
Trades : 264
-
Taux de réussite : 63.26 %
-
Profit net : $1,771.88
-
Facteur de profit (Profit Factor) : 3.10
Période "Out-of-Sample" (Hors échantillon, à partir du 2025-08-31)
-
Trades : 158
-
Taux de réussite : 67.09 %
-
Profit net : $2,274.41
-
Facteur de profit : 3.44
Métriques détaillées
Métriques de rentabilité (Global)
-
Profit brut : $5,821.29
-
Perte brute : $-1,775.00
-
Facteur de profit : 3.28
-
Gain moyen : $21.32
-
Perte moyenne : $-11.91
-
Ratio Risque/Rendement (Risk/Reward) : 1.79
-
Espérance par trade : $9.59
-
Plus grand gain : $105.00
-
Plus grande perte : $-47.50
Métriques de risque
-
Drawdown maximum : -17.19 % ($114.89)
-
Durée moyenne du drawdown : 5 jours
-
Durée max. du drawdown : 36 jours
-
Ratio de Sharpe : 3.33
-
Ratio de Sortino : 4.45
-
Ratio de Calmar : 12.84
-
Valeur à Risque (VaR 95%) : -1.47 %
Métriques de régularité
-
Max. gains consécutifs : 11
-
Max. pertes consécutives : 5
-
Taux de réussite mensuel : 89.29 %
-
Meilleur mois : $489.60
-
Pire mois : $-21.06
-
Rendement mensuel moyen : $144.51
-
Rendement hebdomadaire moyen : $36.13
-
Total des semaines : 112
Timing des trades
-
Durée moyenne de détention : 8.4 heures
RÉPARTITION DE LA PÉRIODE HORS ÉCHANTILLON / OOS (Attentes réelles et basées sur la VaR)
| Période | Meilleur réel | Pire réel | Moyenne réelle | Moyenne Bootstrap | Médiane Bootstrap | Meilleur VaR (95%) | Pire VaR (5%) |
| Quotidien (Daily) | $166.06 | $-67.39 | $21.46 | $14.19 | $10.00 | $99.75 | $-47.50 |
| Hebdomadaire (Weekly) | $276.36 | $-114.89 | $58.32 | $57.16 | $49.53 | $181.71 | $-46.66 |
| Mensuel (Monthly) | $489.60 | $-21.06 | $227.44 | $230.00 | $225.24 | $466.62 | $4.97 |
Définition des termes
-
Moyenne réelle (Actual Mean) : Moyenne simple de chaque période OOS (P&L quotidien/hebdomadaire/mensuel).
-
Moyenne Bootstrap (Boot Mean) : Moyenne de 10 000 sommes de périodes calculées par la méthode d'échantillonnage bootstrap.
-
Médiane Bootstrap (Boot Median) : 50ème centile de 10 000 sommes de périodes calculées par bootstrap.
-
Meilleur VaR (VaR Best) : 95ème centile de 10 000 sommes de périodes calculées par bootstrap (scénario optimiste).
-
Pire VaR (VaR Worst) : 5ème centile de 10 000 sommes de périodes calculées par bootstrap (scénario défavorable).
Durée du Drawdown en période OOS
-
Durée moyenne du drawdown : 3 jours
-
Durée max. du drawdown : 21 jours