Paradox M5
- Experts
- Versione: 7.0
- Aggiornato: 14 giugno 2026
- Attivazioni: 5

This is Gold XAUUSD mean reversion/trend following hybrid EA which is generally broker tolerant.
How to use:
1) Attach to 5 min chart XAUUSD.
2) Enabling trailing stops increases win rate from 60% to 70% but reduces profit potential. Disabling trailing stops is strongly recommended.
3) To use spread adjusted position sizing you must optimize parameters to your broker data feed using real ticks over a meaningful span of time, otherwise it won't work as intended. Cuirrent parameters were optimized with Vantage data feed. Properly optimized position sizing significantly reduces risk, drawdown especially for prop firm data feeds, but reduces profit potential. Optionally you can disable trading during certain spread regimes. High uncertainty regime is good for trading because reflects high predictability of the market and broker defensive stance.
================================================================================
EXECUTIVE SUMMARY
================================================================================
Account Performance
Initial Balance: $100.00
Final Balance: $4,125.63
Net Profit/Loss: $4,046.29
Total Return: 4,025.63%
Trading Period: 832 days (2024-03-01 to 2026-06-11)
Trading Activity
Total Trades: 422
Winning Trades: 273 (64.69%)
Losing Trades: 149 (35.31%)
Average Trade: $9.59
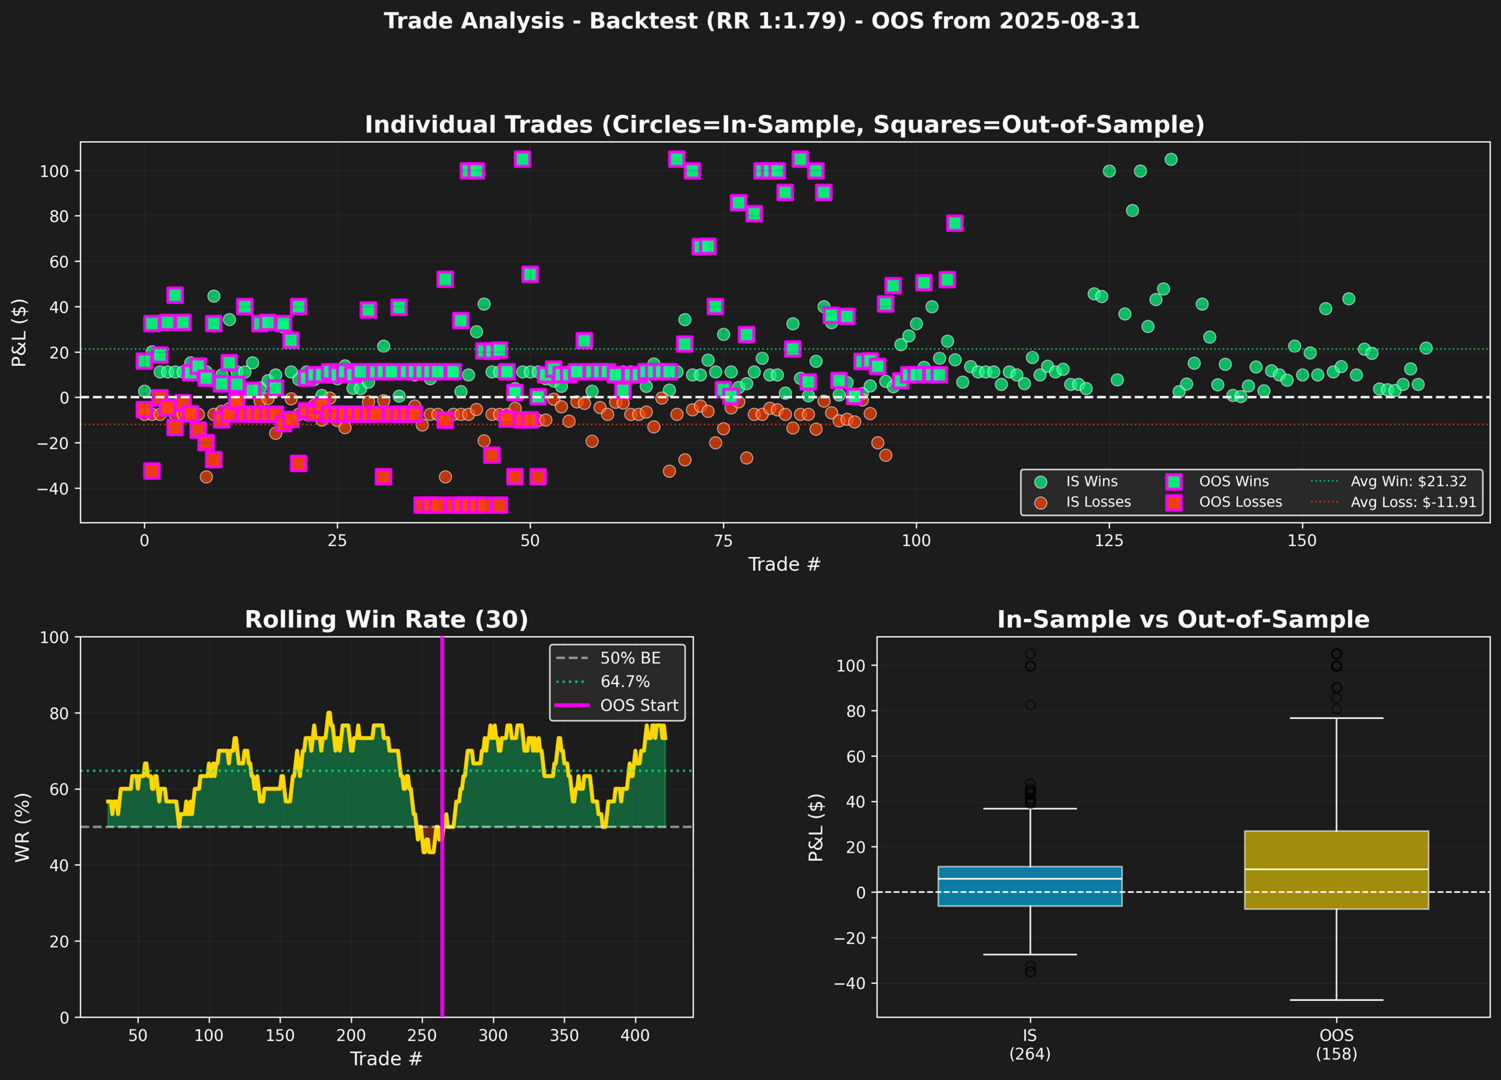
In-Sample Period (Before 2025-08-31)
Trades: 264
Win Rate: 63.26%
Net Profit: $1,771.88
Profit Factor: 3.10
Out-of-Sample Period (From 2025-08-31)
Trades: 158
Win Rate: 67.09%
Net Profit: $2,274.41
Profit Factor: 3.44
Profitability Metrics (Overall)
Gross Profit: $5,821.29
Gross Loss: $1,775.00
Profit Factor: 3.28
Average Win: $21.32
Average Loss: $-11.91
Risk/Reward Ratio: 1.79
Expectancy per Trade: $9.59
Largest Win: $105.00
Largest Loss: $-47.50
Risk Metrics
Maximum Drawdown: -17.19% ($114.89)
Avg Drawdown Duration: 5 days
Max Drawdown Duration: 36 days
Sharpe Ratio: 3.33
Sortino Ratio: 4.45
Calmar Ratio: 12.84
Value at Risk (95%): -1.47%
Consistency Metrics
Max Consecutive Wins: 11
Max Consecutive Losses: 5
Monthly Win Rate: 89.29%
Best Month: $489.60
Worst Month: $-21.06
Avg Monthly Return: $144.51
Avg Weekly Return: $36.13
Total Weeks: 112
Trade Timing
Avg Holding Time: 8.4 hours
================================================================================
OUT-OF-SAMPLE PERIOD BREAKDOWN (Actual & VaR-Based Expectations)
================================================================================
PERIOD ACTUAL BEST ACTUAL WORST ACTUAL MEAN BOOT MEAN BOOT MEDIAN VaR BEST (95%) VaR WORST (5%)
---------- -------------- -------------- -------------- -------------- -------------- -------------- --------------
Daily $ 166.06 $ -67.39 $ 21.46 $ 14.19 $ 10.00 $ 99.75 $ -47.50
Weekly $ 276.36 $ -114.89 $ 58.32 $ 57.16 $ 49.53 $ 181.71 $ -46.66
Monthly $ 489.60 $ -21.06 $ 227.44 $ 230.00 $ 225.24 $ 466.62 $ 4.97
Actual Mean = Simple average of each OOS period (daily/weekly/monthly P&L)
Boot Mean = Mean of 10,000 bootstrapped period sums
Boot Median = 50th percentile of 10,000 bootstrapped period sums
VaR Best = 95th percentile of 10,000 bootstrapped period sums (optimistic scenario)
VaR Worst = 5th percentile of 10,000 bootstrapped period sums (adverse scenario)
OOS DRAWDOWN DURATION
Avg Drawdown Duration: 3 days
Max Drawdown Duration: 21 days