Angle Market Structure
- Indicateurs
- Quang Huy Quach
- Version: 1.52
Overview
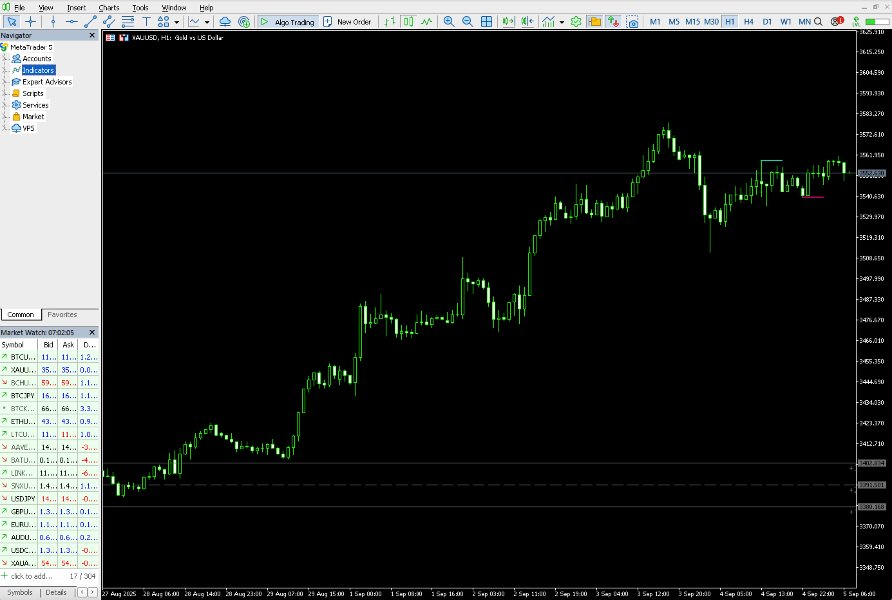
The Angle Market Structure indicator for MetaTrader 5 is a powerful analytical tool designed to automatically identify and visualize key market structure elements directly on your trading chart. It helps traders understand price action by highlighting significant Pivot Highs and Pivot Lows, detecting Break of Structure (BOS) events, and projecting potential deviation levels.
This indicator provides a dynamic visual representation of market trends and potential turning points, aiding in decision-making. It is a technical analysis tool intended to assist traders in their market observation and strategy development. It does not provide financial advice or guarantee future profits. Trading involves significant risk, and past performance is not indicative of future results.
Key Features
- Dynamic Market Structure Identification: The indicator automatically detects and draws the most recent significant Pivot Highs and Pivot Lows. These form the basis of the market's resistance (upper line) and support (lower line) structure. A unique "angle" mechanism allows these lines to dynamically adjust, requiring a more decisive price movement to confirm a breakout.
- Break of Structure (BOS) Detection: When the price decisively breaks above a resistance line or below a support line, the indicator identifies this as a Break of Structure. This event is visually marked on the chart, and a counter indicates consecutive breakouts in the same direction.
- Dynamic Deviation Levels: Following a Break of Structure, the indicator projects potential price targets or reaction zones. These "deviation levels" are calculated based on the Average True Range (ATR) and appear as horizontal lines (+1, +2, +3 for bullish BOS; -1, -2, -3 for bearish BOS).
- Real-time Alerts: Stay informed about critical market events without constantly monitoring the charts. The indicator offers customizable alerts for:
- New Pivot Formation: Notifies when a significant Pivot High or Pivot Low is confirmed.
- Break of Structure (BOS): Alerts you immediately when price breaks a key market structure level.
- Deviation Level Touch: Informs you when price reaches one of the projected deviation targets.
- Note: Alerts are designed to fire only on the most recent, real-time bar to avoid historical notifications during chart loading or backtesting.
How to Install
- Download: Download the AngleMarketStructure.mq5 file.
- Open MetaTrader 5: Launch your MetaTrader 5 terminal.
- Open Data Folder: Go to File -> Open Data Folder .
- Navigate to Indicators: In the opened folder, go to MQL5 -> Indicators .
- Place File: Copy the AngleMarketStructure.mq5 file into this Indicators folder.
- Restart MetaTrader 5: Close and restart your MetaTrader 5 terminal.
- Attach to Chart: In the Navigator window (Ctrl+N), expand Indicators -> Custom . Find AngleMarketStructure , then drag and drop it onto your desired chart.
Input Parameters
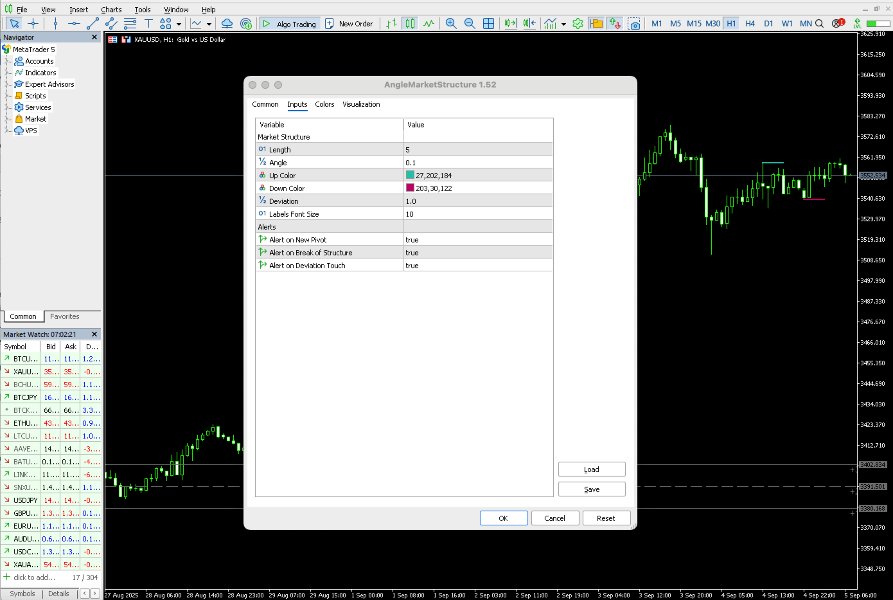
The indicator offers a range of customizable parameters to suit your trading style and preferences. These can be accessed via the indicator's properties window (Ctrl+I, then select the indicator and click "Properties").
Market Structure
- Length: Defines the lookback period for identifying Pivot Highs and Pivot Lows. A pivot is confirmed if it's the highest/lowest point within Length bars to its left and Length bars to its right.
- Angle: A multiplier for ATR that controls the "slope" of the market structure lines. A higher value creates a steeper slope, requiring a more aggressive breakout to confirm.
- Up Color: The color used for bullish (upward) market structure lines and labels.
- Down Color: The color used for bearish (downward) market structure lines and labels.
- Deviation Size: A multiplier for ATR that determines the spacing of the deviation levels after a Break of Structure.
- Labels Size: The font size for the numerical labels indicating consecutive breakouts.
Alerts
- Alert on New Pivot: Set to true to receive an alert when a new Pivot High or Pivot Low is confirmed.
- Alert on Break of Structure: Set to true to receive an alert when price breaks a market structure line (BOS).
- Alert on Deviation Touch: Set to true to receive an alert when price touches one of the projected deviation levels.
How to Interpret the Indicator
The Angle Market Structure indicator provides clear visual cues:
- Green/Blue Lines: These represent dynamic resistance levels. They are drawn from confirmed Pivot Highs and adjust over time. A break above this line indicates a bullish shift in market structure.
- Red Lines: These represent dynamic support levels. They are drawn from confirmed Pivot Lows and adjust over time. A break below this line indicates a bearish shift in market structure.
- Numbered Labels (e.g., "+1", "-1"): These labels appear near the breakout point and indicate the count of consecutive Breaks of Structure in that direction.
- Deviation Lines (+1, +2, +3, -1, -2, -3): These horizontal lines appear after a BOS. They represent potential price targets or areas where price might find temporary support/resistance or reverse. For example, after a bullish BOS, price might target +1, +2, or +3 deviation levels.
Application in Trading
This indicator can be a valuable addition to your trading analysis:
- Trend Confirmation: A series of bullish BOS events (price breaking above resistance) confirms an uptrend, while bearish BOS events (price breaking below support) confirm a downtrend.
- Entry Points: Traders might consider entry opportunities upon a confirmed Break of Structure, especially if aligned with the overall trend.
- Target Levels: The deviation lines can serve as potential profit-taking targets or areas to watch for price reactions.
- Risk Management: Understanding current market structure helps in setting stop-loss levels (e.g., below a newly formed support after a bullish BOS).
- Confluence: Use this indicator in conjunction with other technical analysis tools and your trading strategy for stronger confirmations.
Important Notes & Disclaimer
- No Financial Advice: This indicator is a technical analysis tool for educational and analytical purposes only. It does not constitute financial, investment, or trading advice.
- Risk Disclosure: Trading in financial markets carries a high level of risk, and you may lose more than your initial investment. Only trade with money you can afford to lose.
- Thorough Testing: Always test any indicator or trading strategy thoroughly on a demo account before applying it to a live trading environment.
- Market Conditions: Indicator performance can vary significantly across different market conditions, instruments, and timeframes.
- No Guarantees: There are no guarantees of profit or freedom from loss. Past performance is not indicative of future results.
Conclusion
The Angle Market Structure indicator aims to provide a clear and dynamic visualization of market structure, helping traders identify significant price movements and potential trading opportunities. By combining automated structure detection with real-time alerts, it serves as a practical tool for enhancing your technical analysis.
