VWAP Indicator
- Indicateurs
- Version: 5.1
- Mise à jour: 19 mars 2024

Volume Weighted Average Price (VWAP)
The volume weighted average price (VWAP) is a trading benchmark used by traders that gives the average price a security has traded at throughout the day, based on both volume and price. It is important because it provides traders with insight into both the trend and value of a security.
This indicator VWAP V2 is free and is the manual version of the extended Easy VWAP indicator (30 Euro), where the date and time properties are automatically entered. With the EasyVWAP it is possible to see 1 or more VWAP indicators on the map with a single click per VWAP indicator. The difference between VWAP V2 and Easy VWAP is that you have to manually enter the date and time in the properties in VWAP V2 to draw the indicator.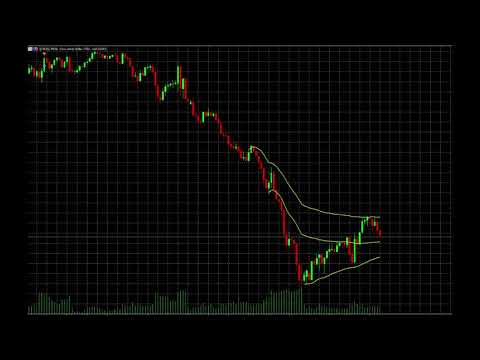


NK225では機能しにくいVWAPですが、CFDではいい感じです。