Price Boundary Predictor
- Indicateurs
-
Michael Rajnarine Sawh
 Michael graduated from Cambridge University and trained at the Financial Times. He qualified as a Chartered Financial Analyst and performed fund management roles with Swiss Re, UBS and Aberdeen Asset Management, successfully investing in global equity, debt, currency, commodity and property markets
 - Version: 1.10
- Mise à jour: 23 mars 2024
- Activations: 5
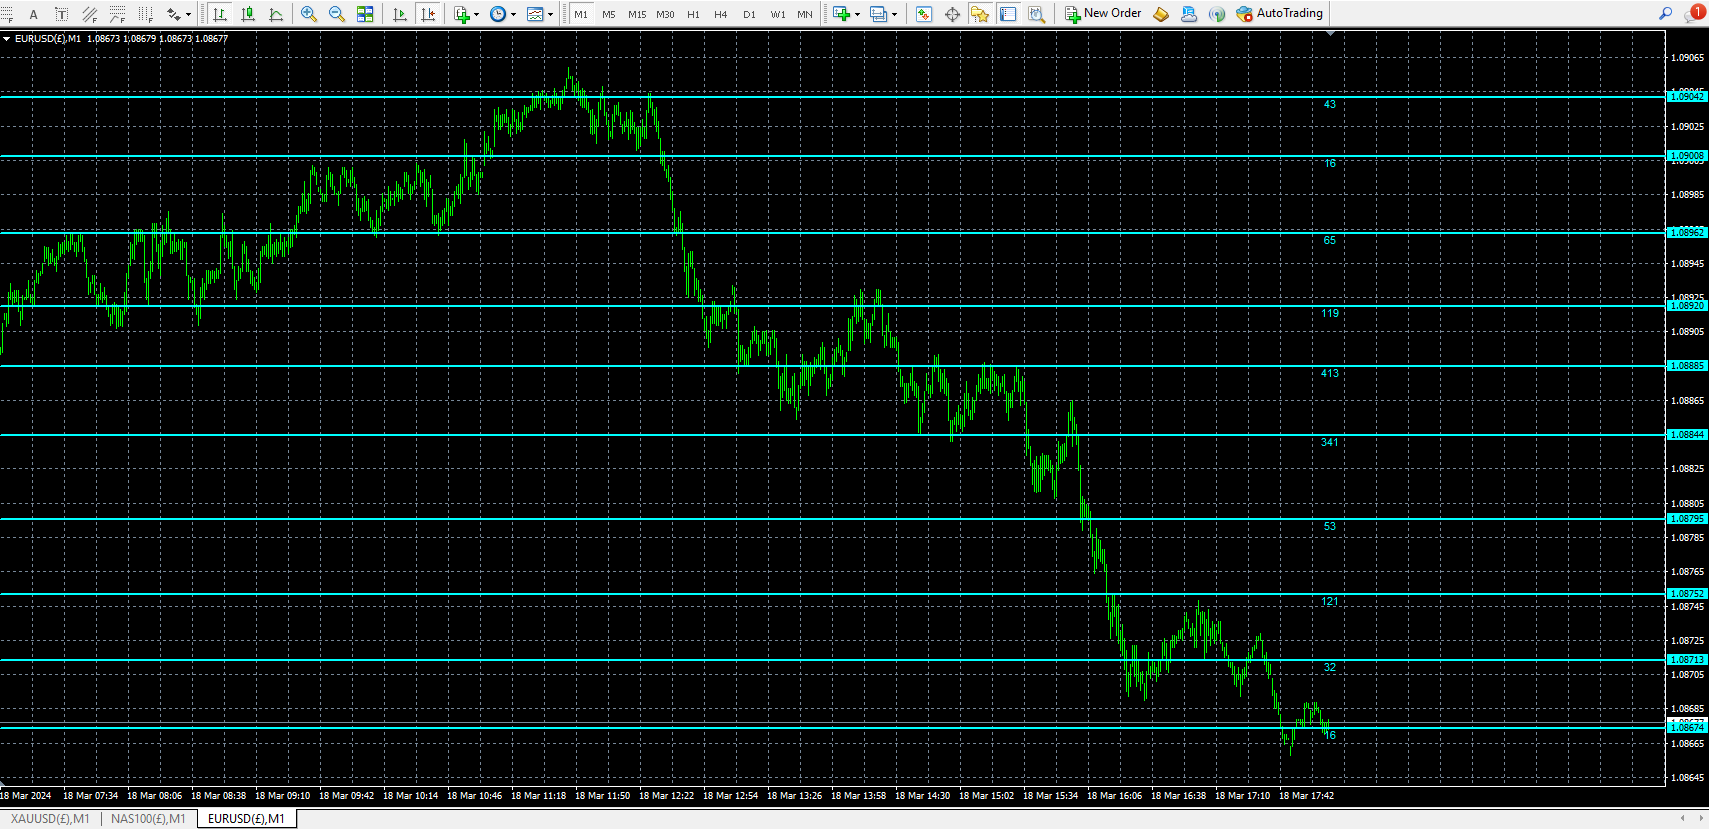
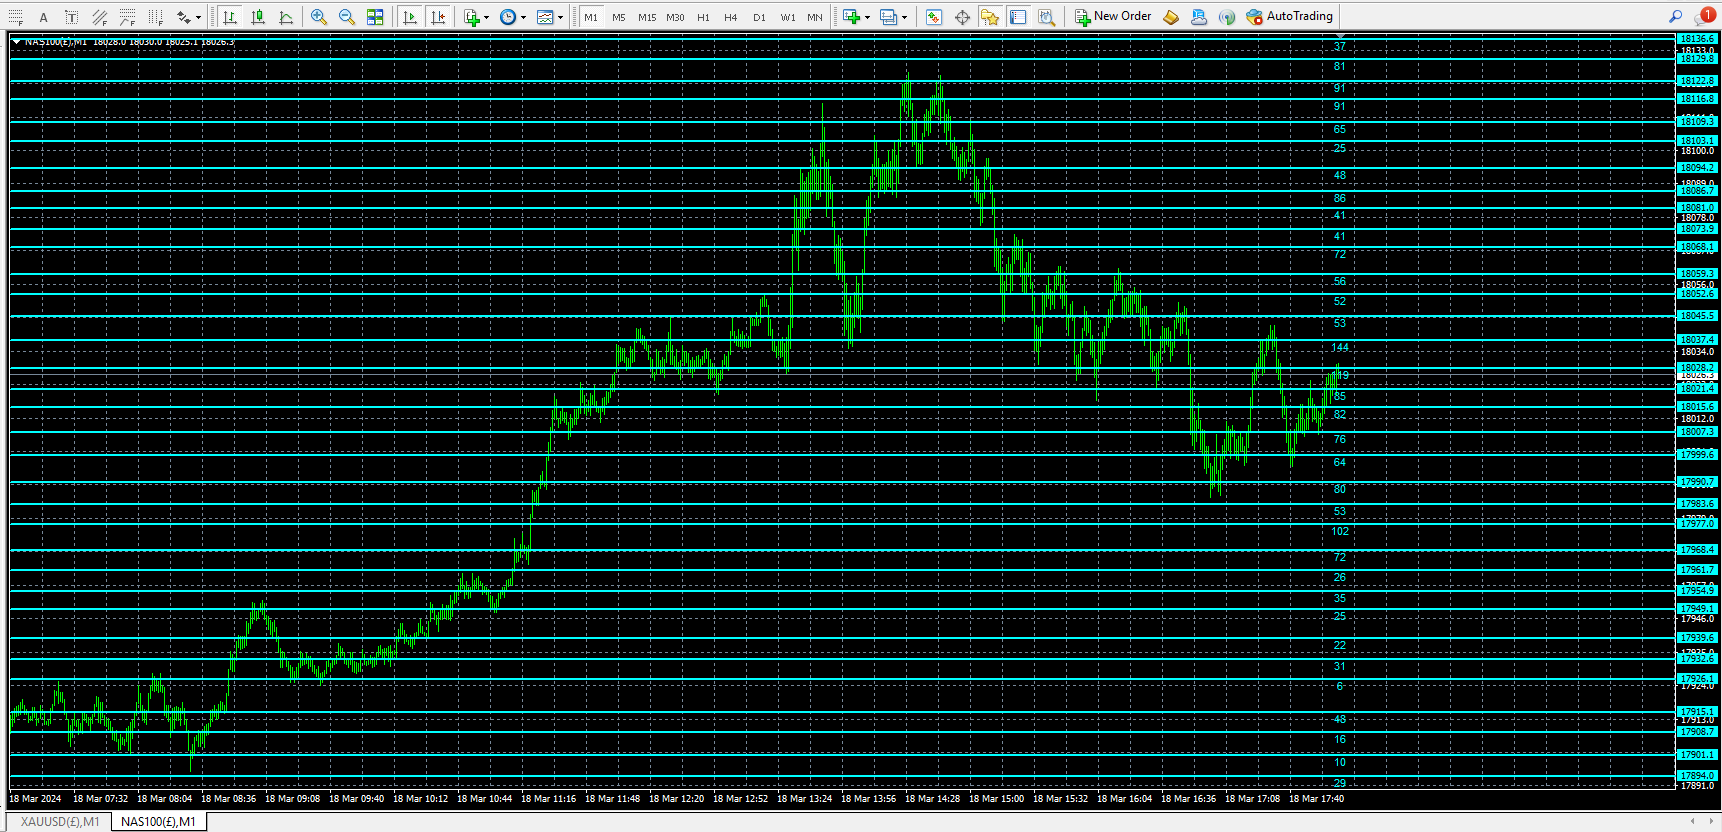
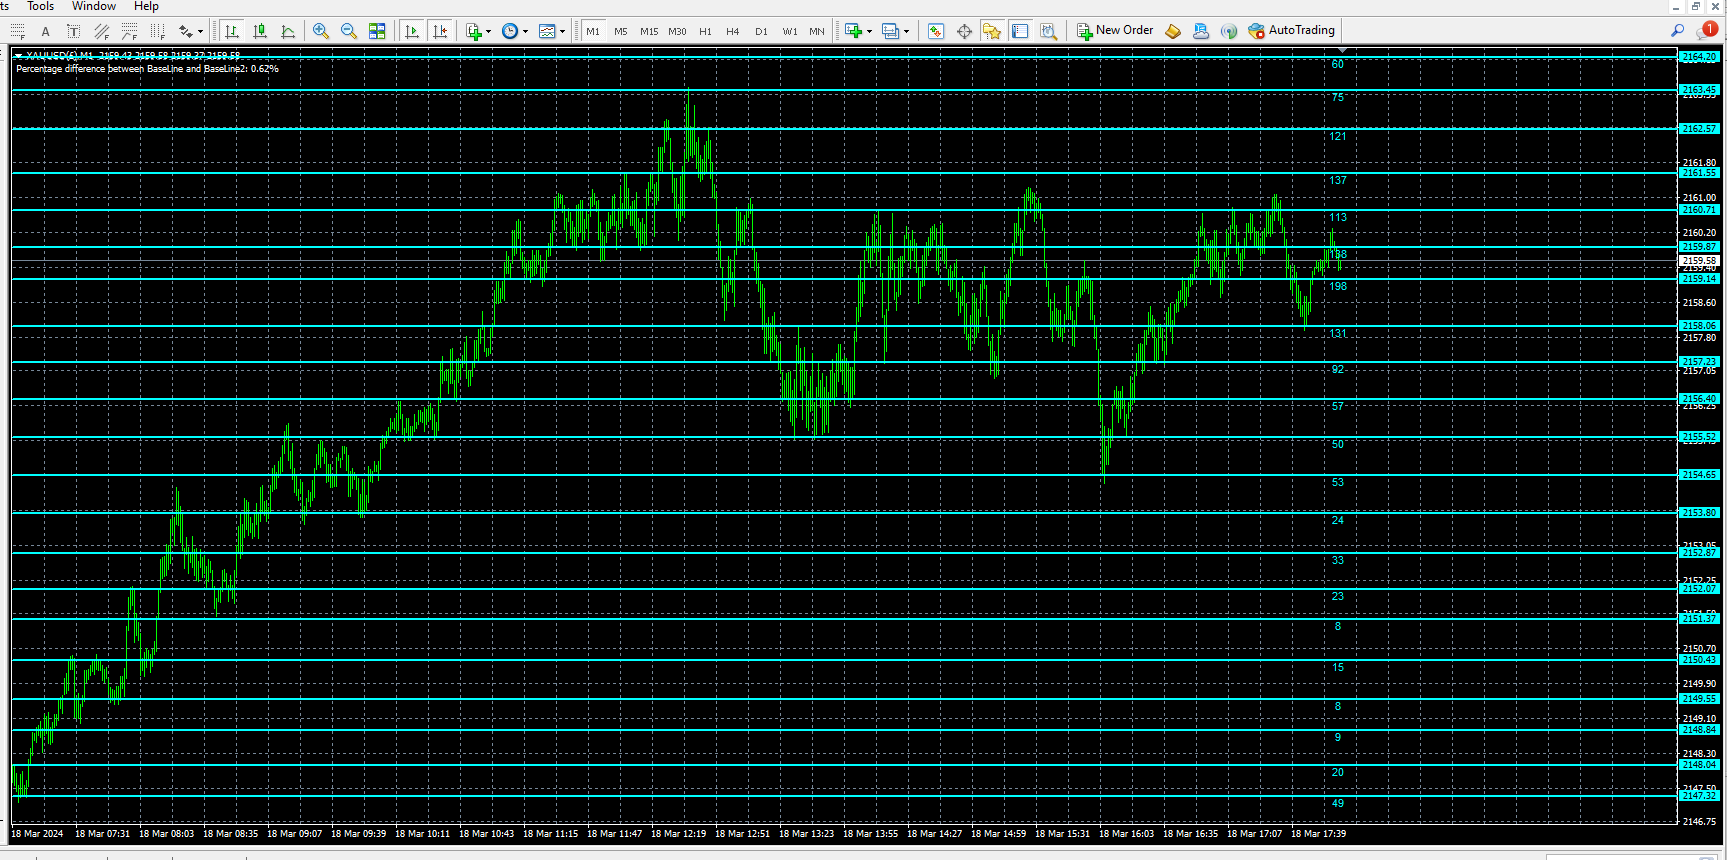
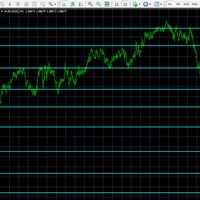
A powerful chart indicator which intelligently analyses Index, FX & Commodity prices to identify the strongest support and resistance price boundaries.
Each line shows where prices consistently close, while the frequency of these matching prices is quoted to reflect each boundary strength.
Use these predictive boundaries to identify pivot points, resistance and support levels for crossover, trending, reversal and channel strategies.
For FX pairs, set volatility filter = 1
For Indices & Commodities, set volatility filter = 2
Too many predicted boundaries? Increase the volatility filter to reduce the number of predicted boundaries and/or decrease the price history analysed.
Too few predicted boundaries? Decrease the volatility filter to increase the number of predicted boundaries and/or increase the price history analysed.
Works across all time periods, intraday and multiday.
Due to system resources consumed in analysing historic data, avoid increasing the number of bars analysed too high.
Remember to use all indicators carefully as guides to the direction of potential price movements.