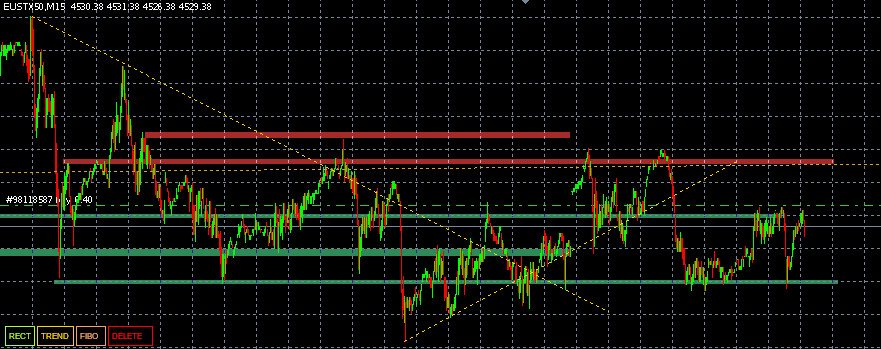
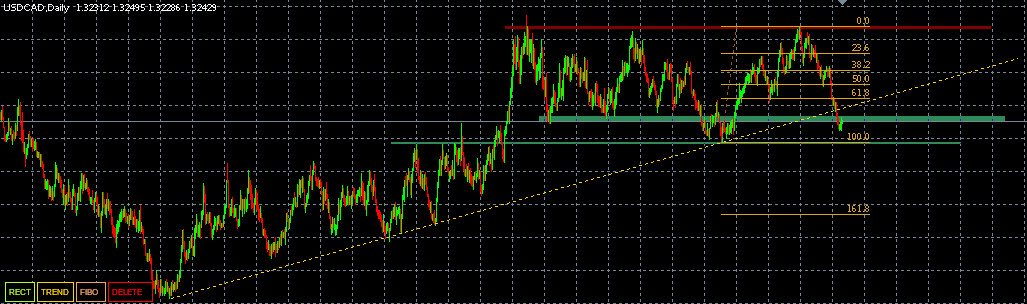
Simple Chart Analysis Tool
- Indicateurs
- Version: 1.2
- Mise à jour: 2 janvier 2024
- Activations: 5
Simple Chart Analysis Tool (SCAT)
Cet outil permet de dessiner des droites de tendance, des zones de polarité, supports et résistances, des retracements de Fibonacci et de les sauvegarder.
L'utilisateur dispose de 4 boutons qui sont affichés dans leur configuration par défaut en bas a gauche de la fenêtre principale.
- Un bouton "Level" permettant de dessiner des zones de support, résistance
- Un bouton "Trend" permettant de dessiner une droite de tendance
- Un bouton "Fibo" permettant d'afficher un retracement de Fibonacci
- Un bouton "DELETE" qui permet de supprimer l'objet sélectionné.
Une fois après avoir appuyé sur le bouton (hors bouton DELETE) de son choix, un premier clic détermine la position d’origine de l’objet, un second sa position finale.
Tout ajout au graphique est sauvegardé permettant ainsi au trader de capitaliser sur ses analyses.
Toute modification est sauvegardée.
Si l'utilisateur décide d'assigner une couleur à un objet créé avec cet outil, la couleur est sauvegardée.
La sauvegarde est faite dans le fichier indiqué par l'utilisateur (par défaut le nom du fichier est "chartAnalysis_Record.csv").
Le objets ajoutés sont fonction du courtier, donc l'utilisateur pourra importer ses analyses sur l'ensemble de ses comptes, à partir du moment où ils appartiennent au même courtier.
Enfin il est possible de partager ce fichier, faisant ainsi bénéficier de ses analyses toute personne disposant de l’outil SCAT.