Simple Chart Analysis Tool

This tool allows you to draw trend lines, polarity zones, supports and resistances, Fibonacci retracements and save them.

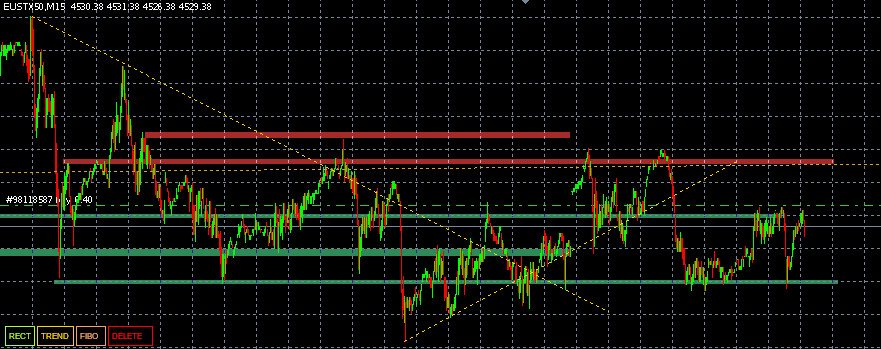
The user has 4 buttons which are displayed in their default configuration at the bottom left of the main window :
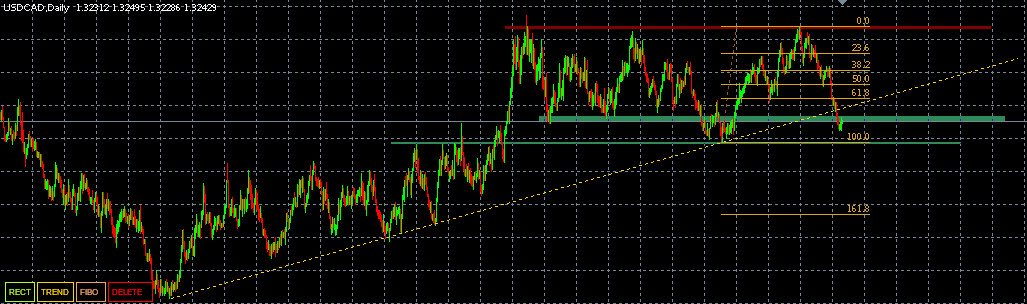
- A "Level" button allowing you to draw support and resistance zones

- A “Trend” button allowing you to draw a trend line
- A “Fibo” button allowing you to display a Fibonacci retracement
- A “DELETE” button which allows you to delete the selected object.

After pressing the button (excluding DELETE button) of your choice, a first click determines the original position of the object, a second its final position.

Any addition to the chart is saved, allowing the trader to capitalize on his analyses.

Any modification is saved.
If the user decides to assign a color to an object created with this tool, the color is saved.

The backup is made in the file indicated by the user (by default the file name is "chartAnalysis_Record.csv").
The objects added depend on the broker, so the user will be able to import their analyzes on all of their accounts, as long as they belong to the same broker.

Finally, it is possible to share this file, thus allowing anyone who has the SCAT tool to benefit from its analyses.


Önerilen ürünler
Mongol Indicator2
Sumiyabazar Buyanjargal
It's a variation of mid of HH and LL since it compares the higher of HH or LL against a period and twice the number of bars back to avoid whipsaws. I used to display this against lines on a chart, but made a histogram out of it and it looks interesting. It looks good at gauging trend strength and general turns (see image below). The name of the indicator is BAM, which is an acronym for "Below and Above Mid". Ways to use it: 1. To see general trend on longer TFs (more than 30 bars back).
Stokastik Çoklu Para Birimi Tarayıcı Panosu MT4 , Stokastik osilatörü kullanarak birden fazla döviz çifti ve zaman diliminde sinyalleri izlemek için tasarlanmış güçlü bir araçtır. Sinyalleri semboller ve zaman dilimlerine (M1'den MN1'e kadar) göre düzenleyen bir ızgara formatı sunar. Traderlar, stratejilerine uygun olarak belirli zaman dilimlerini etkinleştirebilir veya devre dışı bırakabilir. MT5 sürümü burada mevcuttur: Stochastic Oscillator Multicurrency Scanner MT5 Detaylı dokümantasyon için
Golden Move 2
Damian Mateusz Wojtowicz
The best indicator out there, try it yourself! Please leave your positive comments and reviews! Settings: AlertConfirmation: truns on and off alerts CalculatedBars: how many bars will be calculated Distance : arrow distance Buffers: Buffer0 (Arrow Buy) Buffer1 (Arrow Sell) Buffer2 (Empty) Buffer3 (Empty) Buffer4(Buy value == 1) Buffer5(Sell value ==1)
This is a simple arrow system based on Engulfing Candlestick Pattern. It gives you alerts on your smartphone when there is an engulfing candlestick pattern happens. Which type of alerts available? 1. It paints on chart Up/Down Arrows. 2. Popup message and sound alert in trading terminal window. 3. Push notification or Alert on your Android and IOS mobile phones (requires MT4 or MT5 app installed!) *Note: Use it on higher timeframes like H4 (4 hours), D1 (1 Day) then find trade opportunities on s
The advantages of EA TWO CANDLE SMART are: It is equipped with various filters, including: maxspread, maxlot, takeprofit (4 step), stop loss (3 step), profit target per day, and many more. Open order BUY = If iClose[2] > iOpen[2] && iClose[1] > iOpen[1]. Open order SELL = If iClose[2] < iOpen[2] && iClose[1] < iOpen[1]. Target_profit_perday=50; ==> can work on forward test. lockprofit=2;//Minimal Profit in money Step_LockProfit_in_Money=25; Stoploss_in_Money=1000; Stoploss_in %=50;==> Stoploss
Ziwox Fundamental Trader Ziwox Fundamental trader, finansal piyasa yatırımcılarının EA bilgi verileriyle akıllı kararlar almasına yardımcı olan bir ticaret asistanıdır. Bu EA, para birimlerinin temel önyargısı, bir çift üzerindeki Gerçek zamanlı perakende tüccarlar oranı duyarlılığı, Banka ve enstitü tahmini, COT rapor verileri ve karmaşık bir EA panelindeki diğer veriler gibi gerekli tüm bilgileri yakalamak için çevrimiçi kaynakları kullanır. Kısaca, Manuel tüccarların daha iyi kararlar alması
KT Candlestick Patterns Scanner is a Multi-Symbol and Multi-Timeframe scanner that fetches and shows various candlestick patterns on 28 currency pairs and 9 time-frames concurrently . The scanner finds the candlestick patterns by loading the KT Candlestick Patterns indicator as a resource in the background. Features The scanner can find the candlestick patterns on 252* combinations of symbols and time-frames from a single chart. Open the signal's chart loaded with a predefined template with a s
PTW NON REPAINT TRADING SYSTEM + HISTOGRAM Non-Repainting ,   Non-Redrawing   and   Non-Lagging  Trading System. Does the following: - Gives Accurate Entry and Exit Points - Scalping, Day and Swing Trading  - 95% Accuracy  - Targets, where to take profits. - Shows Trends, Support and resistance levels - Works on All Brokers - Works on All Currencies, CFDs and Stocks - It does not place trades for you, it only shows you what trades to place. - It works on All Timeframes - It is for Trend or ran
The MT4 " DayLevelsSignalPro " indicator . Signal Indicator – generates the most accurate buy / sell signals . Noise filtering indicator  – reduces false signals . Signal information with a clear , understandable and visually convenient view . User- friendly graphical interface ( colors , sound notifications , customization options ) . - Generation of a breakdown signal for significant peaks of the Current day . - Generation of a signal for the breakdown of the previous Day 's Level - Generation
Bloglar : https://www.mql5.com/en/blogs/post/761835 MT4 Sürümü : https://www.mql5.com/en/market/product/122732 MT5 Sürümü : https://www.mql5.com/en/market/product/122733 KORLASYON USTASI : ÇİFTLERİ İKİYE KATLAYIN, RİSKLERİ YARIN Negatif Korelasyon ve Otomatik Koruma için Akıllı EA Korelasyon Ustası, döviz çiftleri arasındaki negatif korelasyon stratejisini kullanan otomatik bir Uzman Danışmandır. Karşıt çiftlerde (örn. EURUSD Al ve USDCHF Sat) zıt pozisyonlar açarak, bu EA riskleri en aza
Tahmin etmeyi bırakın. İstatistiksel avantajla işlem yapmaya başlayın. Hisse senedi endeksleri forex gibi işlem görmez. Tanımlanmış seansları vardır, gecelik boşluklar oluştururlar ve öngörülebilir istatistiksel kalıpları takip ederler. Bu gösterge, DAX, S&P 500 ve Dow Jones gibi endeksleri güvenle işlem yapmanız için ihtiyaç duyduğunuz olasılık verilerini sağlar. Onu farklı kılan nedir Çoğu gösterge size ne olduğunu gösterir. Bu, muhtemelen bir sonra ne olacağını gösterir. Her işlem gününde, gö
This Indicator will notified you when time to entry into the market, build with double william percent range strategy.  --> Buy Notification will flag with the blue arrow --> Sell Notification will flag with the red arrow After Flag Appear, the market usually explode but carefully you must performs double check because weakness of this indicator when in the end of the trend
Implementation of indication of trend movement with moments for potential stops in the Cloud Power indicator. The transition to the shadow warns of a possible reversal. The entry of the price inside the shadow speaks of a flat movement. The indicator tracks the market trend with unmatched reliability, ignoring sharp market fluctuations and noise around the average price. Simple, visual and efficient use. The indicator does not redraw and does not lag. It can be easily used as an independent t
This is a professional Trend Sim indicator. The intelligent algorithm of the Trend Sim indicator accurately detects the trend, filters out market noise and generates input signals and exit levels. Functions with advanced statistical calculation rules improve the overall performance of this indicator. The indicator displays signals in a simple and accessible form in the form of arrows (when to buy and when to sell). Knowing the entry point of each of the currencies is very important for every f
IVolX 2 DPOC
Denis Chebatarev
Vol 2 DPOC volume vol 2 DOC-dynamic horizontal volume indicator for any time periods Main settings of the indicator: Volume Source -selecting data for volumes (tick or real) DPOCOn -enabling / disabling the indicator DPOCFrom -calculation start date DPOCTo -settlement end date The indicator allows you to manually select areas on the chart to analyze changes in the maximum volume over time. You can do this by using vertical lines and moving them along the chart. Or by setting specific dates in
Tek grafik. Tam kontrol. Her grafikteki nesneleri, renkleri ve ayarları ayrı ayrı yönetmek için zaman kaybetmeyi bırakın.       Grafik Senkronizasyon Yöneticisi ile   şunları yapabilirsiniz:       tüm MetaTrader grafiklerinizi senkronize edin, kopyalayın ve kontrol edin       anında—sadece bir panel ve birkaç kısayol kullanarak. Bir kez çizin, her yerde güncelleyin. Grafikleri tek bir tıklamayla açıp kapatın. Çalışma alanınızı temiz tutun.       sembol tabanlı nesne yönetimi   . Ve önemli ayrınt
MoveWave
Andriy Sydoruk
MoveWave - Moving waves are very handy indicators for determining pivot levels. Most Forex traders make decisions based on technical analysis. This type of analysis determines patterns and trends in the market. With the help of complex mathematical equations that are combined and made out in the form of this indicator, the trader will be able to more accurately determine the price reversal levels. Wave theory mathematically represents various behavioral models of the market. It is used as the ba
Oscillator helps determine the direction of the market Shows the direction of the price movement and is painted in the appropriate color. Allows you to conduct trend and counter trend trading It works on all timeframes, on any currency pairs, metals and cryptocurrency Can be used when working with binary options Distinctive features Does not redraw; Simple and clear settings; It works on all timeframes and on all symbols; Suitable for trading currencies, metals, options and cryptocurrency (Bitco
NEXT GEN BOT – GOLD EDITION (XAUUSD)  ️ IMPORTANT NOTICE With Setfile (download in Comments) XAUUSD Pair M1 to M5 TF use (Must be Use Setfile for Backtesting ,Demo or Live Trading ) Only a limited number of licenses remain at the current price. Final Price: $990 NEXT GEN GOLD BOT HAS ARRIVED Following the outstanding success of the original GOLD KING Bot , I am proud to present its next evolution: Next Gen Bot 2026 A precision-engineered, fully automated trading solution designed fo
Linear Trend Predictor - Giriş noktalarını ve yön destek çizgilerini birleştiren bir trend göstergesi. Yüksek/Düşük fiyat kanalını kırma prensibiyle çalışır. Gösterge algoritması piyasa gürültüsünü filtreler, oynaklığı ve piyasa dinamiklerini dikkate alır. Gösterge yetenekleri  Düzeltme yöntemleri kullanılarak piyasa trendi ve ALIM veya SATIŞ emirlerinin açılabileceği giriş noktaları gösterilir.  Herhangi bir zaman dilimindeki grafikleri analiz ederek kısa ve uzun vadeli piyasa hareketlerini
Introduction This indicator detects volume spread patterns for buy and sell opportunity. The patterns include demand and supply patterns. You might use each pattern for trading. However, these patterns are best used to detect the demand zone (=accumulation area) and supply zone (=distribution area). Demand pattern indicates generally potential buying opportunity. Supply pattern indicates generally potential selling opportunity. These are the underlying patterns rather than direct price action. T
Trade Invest Pro - Kripto para dünyasında patron! Bu gösterge kripto para ticareti için idealdir! Trade Invest Pro üzerinde çalışmak yarım yılımızı aldı! Ama boşuna değil! Şimdi sadece destek yakınında doğru sinyaller - direnç seviyeleri! İkili opsiyonlar için m5 m15 zaman dilimlerinde kendini iyi gösterdi! İsteğe bağlı olarak, m30 ve daha fazlası için forex için yapılandırılabilir! Haberlere iyi tepki veriyor! boyamaz! ve programdan kaybolmaz! Kırmızı ok göründüğü anda, düşüş için bir
Vrc Updated
Vimal Chudasama
This is an indicator that has been updated from the previous VRC indicator, which has both buy and sell arrows now, and it is optimised from the previous one. You can try it out, the version is upgraded and might suit your trading style. You can also use this indicator as a confluence, or you can use it as a main signal provider; it can be used along with your strategy or top-down approach analysis. Past performance does not guarantee future performance; kindly do a top-down analysis and keep yo
No parameters Risk index:          Income index:         This product is similar to Martin's system plus random factor, and the program budget 1% profit every day. If not, it will accumulate to the next day; The number of hands on the next day will be increased accordingly. In the test, I used $1000 as the base to start running, and the effect doubled in two months; The overall concept of risk and profit are the same; But because of this, the stability of profit is relativel
Proinsta78
Mikhail Bilan
3.5 (4)
Good afternoon friends! At the request of buyers, now when conditions for buying or selling are met, the indicator will send an alert and push notifications. Push notifications come to the phone, provided that you have the MQL application installed. You just need to enter your MetaQuoteID in the application. You can find it in the MT4 platform in the Service - Settings - Notifications section. I showed the conditions for the signal in the form of screenshots in the section screenshots 1-2 phot
ADR/AWR/AMR Lines Indicator - Professional Range Boundary Display Advanced Multi-Timeframe Range Analysis Tool for Professional Traders Overview The ADR/AWR/AMR Lines Indicator is a sophisticated visual analysis tool that displays dynamic range boundaries across multiple timeframes on your chart. This professional-grade indicator calculates and projects Average Daily Range (ADR), Average Weekly Range (AWR), and Average Monthly Range (AMR) boundaries, providing traders with precise entry/exit l
Gann Box MT4
Frederic Jacques Collomb
5 (1)
Gann Box göstergesi, trader'ların piyasanın kilit seviyelerini tanımlamalarına ve bunlardan yararlanmalarına yardımcı olmak için tasarlanmış güçlü ve çok yönlü bir araçtır. Bu gösterge, grafiğe bir dikdörtgen çizmeyi sağlar ve bu dikdörtgen otomatik olarak stratejik seviyeler olan 0, 0.25, 0.50, 0.75, 1 ile birkaç bölgeye ayrılır. Fiyat bu seviyelerden birine ulaştığında, alarmlar tetiklenir ve bu, ticaret kararları için değerli bir destek sağlar. Çizdiğiniz bölgeye göre piyasanın gelişimini an
Golden Scalper PRO
Felipe Jose Costa Pereira
3.83 (12)
Golden Scalper PRO: Teknolojimiz Yanınızda! Kullanım Kılavuzu ve Konfigürasyon Dosyaları: Satın alma sonrası kılavuz ve konfigürasyon dosyaları için benimle iletişime geçiniz. Fiyat: Lisans satış sayısına göre artar. Kalan Kopya Sayısı: 3 Altın, finansal piyasalardaki en volatil varlıklardan biri olarak işlem yapmak büyük bir hassasiyet, titiz analiz ve etkili risk yönetimi gerektirir. Golden Scalper PRO , tam da bu ilkeleri sağlam ve sofistike bir sistemde birleştirmek üzere geliştirilmiştir v
Muvi2A
Mikhail Bilan
Similarly with sales. Additionally, the indicator contains a buy or sell signal in the form of arrows.  Power type indicator.  Test it in a tester to make sure that it works. It is important to select settings depending on the volatility of the asset. Good for scalping and long-term trading. Lots of settings. The most interesting thing is the ability to set in the indicator for moving on timeframes from 1 minute on the timeframes of the main chart. The signals become even more accurate) It
Bu ürünün alıcıları ayrıca şunları da satın alıyor
Precautions for subscribing to indicator This indicator only supports the computer version of MT4 Does not support MT5, mobile phones, tablets The indicator only shows the day's entry arrow The previous history arrow will not be displayed (Live broadcast is for demonstration) The indicator is a trading aid Is not a EA automatic trading No copy trading function The indicator only indicates the entry position No exit (target profit)  The entry stop loss point is set at 30-50 PIPS Or the front hi
Meravith
Ivan Stefanov
5 (2)
Market maker aracı. Meravith şunları yapar: Tüm zaman dilimlerini analiz eder ve geçerli trendi gösterir. Alış ve satış hacimlerinin eşit olduğu likidite bölgelerini (hacim dengesi) vurgular. Farklı zaman dilimlerinden tüm likidite seviyelerini doğrudan grafiğinizde gösterir. Referansınız için metin tabanlı piyasa analizi üretir ve sunar. Mevcut trende göre hedefler, destek seviyeleri ve stop-loss noktalarını hesaplar. İşlemleriniz için risk/ödül oranını hesaplar. Hesap bakiyenize göre pozisyon
Miraculous Göstergesi – Gann Dokuz Kareye Dayalı %100 Tekrarlamayan Forex ve İkili Araç Bu video, Forex ve İkili Opsiyon traderları için özel olarak geliştirilmiş son derece doğru ve güçlü bir ticaret aracı olan Miraculous Göstergesi 'ni tanıtıyor. Bu göstergeyi benzersiz kılan, efsanevi Gann Dokuz Karesi ve Gann Titreşim Yasası 'na dayanmasıdır; bu da onu modern ticarette mevcut en hassas tahmin araçlarından biri yapmaktadır. Miraculous Göstergesi tamamen tekrarlamaz ; yani mum kapandıktan son
Şu anda %40 İNDİRİMLİ! Herhangi bir Acemi veya Uzman Tüccar için En İyi Çözüm! Bu gösterge paneli yazılımı 28 döviz çifti üzerinde çalışıyor. Ana göstergelerimizden 2'sine (Gelişmiş Para Birimi Gücü 28 ve Gelişmiş Para Birimi Dürtüsü) dayanmaktadır. Tüm Forex piyasasına harika bir genel bakış sağlar. Gelişmiş Para Birimi Gücü değerlerini, para birimi hareket hızını ve tüm (9) zaman dilimlerinde 28 Forex çifti için sinyalleri gösterir. Trendleri ve / veya scalping fırsatlarını belirlemek için
Looking for a powerful yet lightweight swing detector that accurately identifies market structure turning points? Want clear, reliable buy and sell signals that work across any timeframe and any instrument? Buy Sell Arrow MT Swing is built exactly for that — precision swing detection made simple and effective. This indicator identifies Higher Highs (HH) , Higher Lows (HL) , Lower Highs (LH) , and Lower Lows (LL) with remarkable clarity. It is designed to help traders easily visualize market str
GoldRush Trend Ok Sinyali GoldRush Trend Ok Sinyali göstergesi, XAU/USD'de yüksek hızlı, kısa vadeli scalperlar için özel olarak tasarlanmış hassas, gerçek zamanlı trend analizi sağlar. 1 dakikalık zaman dilimi için özel olarak tasarlanan bu araç, net giriş noktaları için yön okları gösterir ve scalper'ların değişken piyasa koşullarında güvenle hareket etmelerini sağlar. Gösterge, PRIMARY ve SECONDARY uyarı oklarından oluşur. PRIMARY sinyalleri, trend yönündeki değişikliği gösteren Beyaz ve
"Dragon's Tail" is an integrated trading system, not just an indicator. This system analyzes each candle on a minute-by-minute basis, which is particularly effective in high market volatility conditions. The "Dragon's Tail" system identifies key market moments referred to as "bull and bear battles". Based on these "battles", the system gives trade direction recommendations. In the case of an arrow appearing on the chart, this signals the possibility of opening two trades in the indicated directi
Presenting one-of-a-kind Gann Indicator for XAUUSD IQ Gold Gann Levels is a non-repainting, precision tool designed exclusively for XAUUSD/Gold intraday trading. It uses W.D. Gann’s square root method to plot real-time support and resistance levels, helping traders spot high-probability entries with confidence and clarity. William Delbert Gann (W.D. Gann) was an exceptional market analyst whose trading technique was based on a complex blend of mathematics, geometry, astrology, and ancient calcul
Super Signal – Skyblade Edition Profesyonel No-Repaint / Gecikmesiz Trend Sinyal Sistemi, Olağanüstü Kazanma Oranı ile | MT4 / MT5 için 1 dakika, 5 dakika ve 15 dakika gibi daha düşük zaman dilimlerinde en iyi şekilde çalışır. Temel Özellikler: Super Signal – Skyblade Edition, özellikle trend bazlı işlemler için geliştirilmiş akıllı bir sinyal sistemidir. Yalnızca güçlü, yönlü ve gerçek momentum destekli piyasa hareketlerini tespit etmek amacıyla çok katmanlı bir filtreleme yapısı kullanır. Bu
Pulse Scalping Line - an indicator for identifying potential pivot points. Based on this indicator, you can build an effective Martingale system. According to our statistics, the indicator gives a maximum of 4 erroneous pivot points in a series. On average, these are 2 pivot points. That is, the indicator shows a reversal, it is erroneous. This means that the second signal of the indicator will be highly accurate. Based on this information, you can build a trading system based on the Martingale
Introducing a powerful, precision-engineered indicator that seamlessly combines Pivot Points, Moving Averages, and Multi-Timeframe Analysis to deliver high-probability Buy and Sell signals in real-time. This tool is your strategic edge, designed to identify trend reversals, market momentum, and optimal trade entries, no matter your preferred trading style. Our algorithm goes beyond standard indicators—by analyzing multiple timeframes simultaneously, it spots true market turning points while fi
Weis Wave with Alert
Trade The Volume Waves Single Member P.C.
4.82 (22)
Rental/Lifetime Package Options and Privileges' Rent Monthly Six Months   Yearly/Lifetime Weis Wave with Speed with Alert+Speed Index x x x Manual  x x x Quick Set up Video x x x Blog x x x Lifetime Updates x x x Setup and Training Material x x Rectangle Break Alert Tool      x Discord Access Channel "The SI traders" x   How to trade info visit:    http://www.tradethevolumewaves.com   ** If you purchase please contact me to setup your  : training Room and  complete manual access.  This is
Dynamic Forex28 Navigator
Bernhard Schweigert
4.43 (7)
Dynamic Forex28 Navigator - Yeni Nesil Forex Ticaret Aracı. ŞU ANDA %49 İNDİRİM. Dynamic Forex28 Navigator, uzun zamandır popüler olan göstergelerimizin evrimidir ve üçünün gücünü tek bir göstergede birleştirir: Gelişmiş Döviz Gücü28 Göstergesi (695 inceleme) + Gelişmiş Döviz İMPULS ve UYARI (520 inceleme) + CS28 Kombo Sinyalleri (Bonus). Gösterge hakkında ayrıntılar https://www.mql5.com/en/blogs/post/758844 Yeni Nesil Güç Göstergesi Ne Sunuyor?  Orijinallerde sevdiğiniz her şey, şimdi yeni
Scalping Lines System - özellikle M1-M5 zaman dilimlerinde Altın (XAUUSD) varlığıyla işlem yapmak için tasarlanmış bir scalping işlem sistemidir. Kısa vadeli sinyalleri belirlemek için trend, volatilite ve aşırı alım/aşırı satım piyasa analizi göstergelerini tek bir osilatörde birleştirir. Sinyal çizgileri için tüm dahili parametreler önceden yapılandırılmıştır. MA çizgilerini kullanarak trend yönündeki bir dizi sinyalin süresini düzenleyen "Trend Dalga Süresi" parametresi manuel olarak ayarlan
Algo Trading Indicaor  With this indicator , you’ll have zones and trends that hight probability the price will reverse from it. so will gives you all the help that you need  Why should you join us !?  1-This indicator is logical since it’s working in previous days movement , to predict the future movements. 2-Algo trading indicator will help you to draw trends which is special and are too strong than the basics trend , trends will change with the frame time that you work on . 3-We can use
Product Name:   Quantum Regime Indicator Short Description:   A multi-engine structural regime and volatility filter. Description: Quantum Regime Indicator (QRI) is a sophisticated technical analysis algorithm designed to identify market structure shifts and volatility regimes. Unlike standard indicators that rely on immediate price action, QRI utilizes a hierarchical logic architecture to filter market noise and identify statistical extremes. The indicator is built on the philosophy of "Market
Bu gösterge, pratik ticaret için mükemmel olan otomatik dalga analizine yönelik bir göstergedir! Dava... Not:   Dalga sınıflandırması için Batılı isimleri kullanmaya alışkın değilim. Tang Lun'un (Tang Zhong Shuo Zen) adlandırma kuralının etkisiyle, temel dalgayı   kalem   , ikincil dalga bandını ise   segment   olarak adlandırdım. aynı zamanda segmentin trend yönü vardır. Adlandırma   esas olarak trend segmentidir   (bu adlandırma yöntemi gelecekteki notlarda kullanılacaktır, öncelikle söyleyey
Öncelikle, bu Ticaret Aracının Non-Repainting, Non-Redrawing ve Non-Lagging Gösterge olduğunu vurgulamakta fayda var, bu da onu profesyonel ticaret için ideal hale getiriyor. Çevrimiçi kurs, kullanıcı kılavuzu ve demo. Akıllı Fiyat Hareketi Kavramları Göstergesi, hem yeni hem de deneyimli tüccarlar için çok güçlü bir araçtır. İleri ticaret fikirlerini, Inner Circle Trader Analizi ve Smart Money Concepts Ticaret Stratejileri gibi 20'den fazla kullanışlı göstergeyi bir araya getirerek bir araya g
OrderFlow Absorption – MT4 için Profesyonel Delta ve Absorpsiyon Sinyal Göstergesi OrderFlow Absorption ile gerçek emir akışı analizinin gücünü keşfedin – MetaTrader 4 için nihai delta histogramı ve absorpsiyon sinyal göstergesi. Fiyat hareketlerinin arkasında gerçekte neler olduğunu görmek isteyen traderlar için tasarlanan bu araç, piyasayı hareket ettiren gizli alım/satım baskısını ve absorpsiyon olaylarını ortaya çıkarır. Özellikler Delta Histogramı Görselleştirme:   Alım ve satım baskısını a
Advanced Arrow
Alfred Kamal
3.9 (39)
This indicator depends on some secrets equations to draw Signals with Stop loss and maximum 4 Take profits. There is a free EA depends on this indicator as a gift when you purchase/rent it. Features Simply it gives you entry point as Ready sign (Buy / Sell) and arrow (Buy / Sell) after candle closed, also SL line and 4 TP lines or less. Once SL-TP lines are shown with the arrow, they remains as they are until signal change. It is historical indicator. No Repaint. user manual for V5 please click
POWR Rise Coming
Trade Indicators LLC
This indicator is SO SIMPLE… when the green Rise Coming arrow appears, a price drop may be on the way! Plain and easy profits! As you receive more than one 'Rise Coming' text signal in a downtrend, it means momentum is building larger for a bull run. HOW TO USE 1. When the green "Rise Coming" text appears, a price jump may be on the way! This indicator Never Repaints! To get the best setting it's a matter of tweaking the indicator until it gives you the best results. Our recommendation, and what
Supreme Commander
Ramon Sobrevals Arce
4.13 (8)
The indicator of the indicators. The Most Powerful Technique to Determine Forex Trend Strength in 2023. We have perfected Supreme Commander that it calculates an average of the selected indicators (up to 16) and the selected timeframe (all) with the result of a single trend that indicates the potential of buying and selling.  It includes the following indicators: Accelerator/Decelerator oscillator Average Directional Movement Index Awesome oscillator; Bulls and Bears  Commodity Channel Index; De
Introduction Excessive Momentum Indicator is the momentum indicator to measure the excessive momentum directly from raw price series. Hence, this is an extended price action and pattern trading. Excessive Momentum Indicator was originally developed by Young Ho Seo. This indicator demonstrates the concept of Equilibrium Fractal Wave and Practical Application at the same time. Excessive Momentum detects the market anomaly. Excessive momentum will give us a lot of clue about potential reversal and
" Dynamic Scalper System " göstergesi, trend dalgaları içinde işlem yapmak için scalping yöntemi için tasarlanmıştır. Başlıca döviz çiftleri ve altın üzerinde test edilmiştir, diğer işlem araçlarıyla uyumluluğu mümkündür. Ek fiyat hareketi desteğiyle trend boyunca pozisyonların kısa vadeli açılması için sinyaller sağlar. Göstergenin prensibi. Büyük oklar trend yönünü belirler. Küçük oklar şeklinde scalping için sinyaller üreten bir algoritma trend dalgaları içinde çalışır. Kırmızı oklar yüksel
Bomb Bank Signal
Igor Pereira Calil
5 (1)
Bomb Bank Signal: Your Trusted Indicator for MetaTrader 4 The Bomb Bank Signal is a powerful indicator for MetaTrader 4, designed to identify the most relevant trends in the financial market. If you are looking for a tool that accurately anticipates movements, Bomb Bank is the ally you need. How it Works: This indicator combines three distinct methods – volume analysis, candle closes and symmetrical trend – to detect and signal buying and selling opportunities. Bomb Bank is like a "bomb" whe
F-16 Uçak Göstergesini tanıtıyoruz, ticaret deneyiminizi devrimleştirmek için tasarlanmış son teknoloji bir MT4 aracı. F-16 savaş uçağının eşsiz hızı ve hassasiyetinden ilham alan bu gösterge, finansal piyasalarda eşi benzeri olmayan performans sunmak için ileri algoritmalar ve son teknoloji teknolojileri bir araya getirir. F-16 Uçak Göstergesi ile gerçek zamanlı analiz sunarak yüksek doğruluklu ticaret sinyalleri üretirken rekabetin üzerine çıkacaksınız. Dinamik özellikleri, farklı varlık sınıf
Supply and Demand Dashboard PRO
Bernhard Schweigert
4.8 (20)
Şu anda %40 İNDİRİMLİ! Bu gösterge paneli, birden fazla sembol ve 9 zaman dilimine kadar çalışan çok güçlü bir yazılım parçasıdır. Ana göstergemize dayanmaktadır (En iyi yorumlar: Advanced Supply Demand ).     Gösterge paneli harika bir genel bakış sağlar. Gösterir:    Bölge mukavemet derecesi dahil filtrelenmiş Arz ve Talep değerleri, Bölgelere/ve bölgeler içindeki pip mesafeleri, İç içe geçmiş bölgeleri vurgular, Tüm (9) zaman dilimlerinde seçilen semboller için 4 çeşit uyarı verir. Kişisel
First time on MetaTrader, introducing IQ Star Lines - an original Vedic Astrology based indicator. "Millionaires don't use astrology, billionaires do" . - J.P. Morgan, Legendary American financier and banker. IQ Star Lines, an unique astrological indicator purely based on   Vedic astrology   calculations, published for the   first time on Metatrader.  This unique tool plots dynamic planetary grid lines based on real-time stars, constellations, and celestial movements, which allows you to plot t
Hidden Cycles
Lev Vladimirovic Marushkin
5 (1)
The Only 100% Universal Tool! Stop trading against nature! This is your chance to secure the only indicator rooted in the absolute laws that govern the entire universe. Most tools guess—this one reveals the truth. Buy another toy or buy the truth. Your choice... Based on Universal Laws — NOT Some Guy’s Algorithm: Let the market adjust to the Hidden Cycles Geometry — not the other way around. Most indicators are based on a man-made formula. They often lag, fail over time, or need constant re-o
The Super Arrow Indicator provides non-repainting buy and sell signals with exceptional accuracy. Key Features No repainting – confirmed signals remain fixed Clear visual arrows: green for buy, red for sell Real-time alerts via pop-up, sound, and optional email Clean chart view with no unnecessary clutter Works on all markets: Forex, gold, oil, indices, crypto Adjustable Parameters TimeFrame Default: "current time frame" Function: Sets the time frame for indicator calculation Options: Can be set
Yazarın diğer ürünleri
Ichimoku Hinko Hyo MTF Ichimoku Hinko Hyo MTF is a Multi Time Frame indicator. It allows to overlap several ichimoku indicators (from different timeframes) on the same chart. Doing this allows a better read of the market as informations are directly available to user. It is possible to select different curves to be displayed (Tenkan, Kijoun, Chikou, Kumo) In this version 1.0, it is possible to On M1 chart, overlap M5 and M15 indicators. On M5 chart, overlap M15 and H1 indicators. On M15 chart,
Indicateur Moving Average Filling Affiche deux moyennes mobiles (une courte et une longue) dont la durée et le type (Simple, exponentielle) est paramétrable. L'espace entre les deux moyennes mobiles est alors colorié (rempli) :     - Vert si courte > longue     - Rouge si courte < longue Il est possible de changer les couleurs selon les préférences de chacun / chacune.
Flow MTF
Guillaume Jouans
This indicator takes as parameters the periods for three moving averages (Short, Long, Very_Long) and displays them for the current timeframe: - in the form of a cloud (green if Short is greater than Long, red if Short is less than Long) - as a line for the Very_Long moving average. It also allows you to display the status (BUY or SELL) of these same moving averages but for the M15, H1, H4, W1 and MN1 timeframes. This information is summarized in the window titled "TREND", where, for each timefr
Pivots Points
Guillaume Jouans
Pivots Points Indicator: Displays the Pivots Points lines for the Daily, Weekly or Monthly periods Several parameters are possible: 1 - Choice of calculation method: - Classic - Woodie - Camarilla - Fibonacci 2 - The choice of the period for calculating the pivot points ( Daily, Weekly or Monthly   ) 3 - The display or not of the price labels (to the right of each line) as well as the size of the associated font 4 - The number of pivot points (previous) that we want to display 5 - Po
Filtrele:
İnceleme yok
İncelemeye yanıt