 MetaTrader 5
 Experts
 Indicateurs
 Bibliothèque
 Utilitaires
 Widgets
 Règles
Regardez les tutoriels vidéo de Market sur YouTube
Comment acheter un robot de trading ou un indicateur
Exécutez votre EA sur
hébergement virtuel
hébergement virtuel
Test un indicateur/robot de trading avant d'acheter
Vous voulez gagner de l'argent sur Market ?
Comment présenter un produit pour qu'il se vende bien
Nouveaux Expert Advisors et indicateurs pour MetaTrader 4 - 184
 Les robots de trading effectuent automatiquement les transactions sur le marché, tandis que les indicateurs vous permettent de mieux analyser les cotations et de prédire le comportement des prix. Grâce à ces applications, vous serez en mesure d'effectuer des transactions dans MetaTrader 4 de manière plus avisée, tout en saisissant davantage d'opportunités.
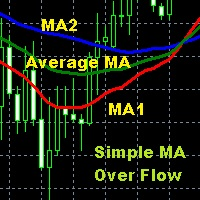
Moving Average is one of the indicators that is widely used in technical analysis which can help to smooth price movements by eliminating some price fluctuations that are less relevant based on past price calculations, so that an average line of price movements is formed within a certain time period. Simple Moving Average Over Flow is an indicator writen by MQL$ language that is given a special additional moving average line based on certain calculations so as to make this moving average better
FREE
New Release! Hello Everyone! I've just released Acronix, a new bot with live 2025 AND 2026 results. Find more about it here: https://www.mql5.com/en/market/product/201513 .
Introduction and Description The commodity channel index (CCI) is an oscillator originally introduced by Donald Lambert in 1980. Since its introduction, the indicator has grown in popularity and is now a very common tool for traders in identifying cyclical trends not only in commodities but also equities and currencies. The
FREE
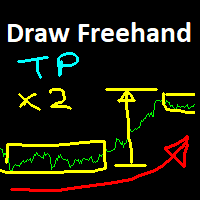
This tool provides a freehand drawing method, to treat the chart space as a blackboard and draw by-hand. Drawings can be made to stick to the CHART (moves with chart scroll), or to stick to the WINDOW (does not move with chart scroll).
Features: all drawings are individually styled, color, width
show/hide each drawing type
delete last drawing drawings, on chart and on window, remain through TF changes and terminal re-starts, until the indicator is removed
Panel: stylable colors scalable in size
Automatic Expert Advisor. Night scalp system, with trend detection and pullback entry. Dynamic exit signal, for SL or TP. Every trade has fix SL. No usage of risky strategies like martingale, hedge, grid etc.
About EA Scalper strategy Technical strategy Can use with small deposits Pairs with best rezults: AUDNZD, AUDCAD, AUDCHF, EURAUD, GBPAUD, USDCHF, CADCHF, EURNZD, EURGBP, GBPCAD, GBPCHF, EURCHF Time Frame: M15 Recommendations Broker account with ECN and low spread Test it first to find out
Master Trend Signal Indicator
TimeFrame - 15 Mins & More
Pairs - All Forex Currency Pairs , Gold , Silver , Crypto, Stock
Once Trend Is UP Cross The Yellow Line, It's Show Colour For Green
Once Trend Is Down Cross The Yellow Line, It's Show Colour For Red Easy TO Identify Trend Strength ON Trading For Scalping, Intraday Trading 5 Purchases left & The Price Increases

В основе индикатора EasyBands лежит тот же принцип, что и при построении Bollinger Band. Однако, данная модификация индикатора использует вместо стандартного отклонения средний торговый диапазон (Average True Range). Соответственно, с данным индикатором абсолютно аналогично можно использовать все стратегии, которые применяются с Bollinger Band. В данной версии индикатора используется двенадцать уровней и средняя линия (белый цвет). Индикация тренда выполнена в виде окраски свечей в зависимости

Crypto Guru ++++++++++++
Welcome to the Crypto Guru EA ++++++++++++++++++++++++++++++++++ My recommendation: use it on very long down trends.
The logic behind this robot is....... Check the day trend, and if it’s down for very long time then connect the robot on that chart.(1m/5m/15m/30m/1H/4H up to you). When all signals are in place the robot then opens only buy trend. ++++++++++++++++++++++++++++++++++
The Ea has the following settings: Recommended Pairs all of in a long down trend Reco
Golden Scalping & Day Trading Signal Indicator You Can Enable Or Disable Scalping Signal Option Once Enable For Scalping More Order Signals Option Or Disable For Scalping Option Intraday Signal Option Pairs : XAUUSD, XAGUSD - EURUSD, GBPUSD,USDJPY, AUDUSD, USDCAD, BTCUSD , USDCHF, GBPJPY Time Frame : 15 Mins, 30 Mins , 1 Hour 5 Purchases left & The Price Increases

Black friday
This type of trading attempts to take advantage of speed and computing resources.
The operational strategy of the EA is based on the use of an input with signal from the Bollinger Bands, ADX, and CCI with an output on the signal of the Donchian Channel, ATR and Alligator. These parameters are fixed and cannot be optimized. You can optimize money management depending on the capital you have.
========================================================================================
Gold Scalping Pro Signal Indicator Pairs : XAUUSD, XAGUSD, Crude OIL , BTCUSD, ETHUSD, EURUSD, GBPUSD, USDJPY, AUDUSD, USDCHF, GBPJPY Setting : Once Market Are Up And Down Side , The Indicator Are Provide Buy And Sell Order Push Notification Time Frame - 5 Mins, 15 Mins, 1 Hour, 4 Hour Additional : You Have Also Trade Manual , Once Trend Power Is Up , Enter Buy Or Trend Power is Down, Enter Sell

A Good , Easy , Readable and handy indicator for experienced and professional traders. It gives bounded signals between zero and one. Easy for investors to comprehend. It gives near and longer trading outlook to investors and helps them to find good opportunities. Indicator gives zero signal on price downturns and signal value equals to one on price upturns. Once again a new type of indicator and rangebound between zero and one .

A very Simple Indicator for experienced and professional traders. It indicates direction of trade and provides signals of best deals. Signal is referred here a point on chart where indicator line turns its direction or converges. This indicator finds underlaying trading asset trade direction and indicates best scenarios of trade as described in screenshots. Where it has run for a period of time and converges to best deal scenarios.
Have a Look!

A value indicator. It is helping tool to indicate the direction of value gain. A best helping tool to trade value. This indicator is equipped with a colored line and a digital tool to indicate value numerically .
This indicator also helps to indicate value during trends. A study based on this indicator shows value of trade significantly changes during trends best tool to chase the trends.
A basic tool for experienced and professional traders to trade percentile of the value. It indicates both values in the form of digits appeared on the left corner of the screen.
Instructions Manual : First choose your desired symbol and then select this tool. Please be remined that this tool is just a helping tool. its upon trader what he desired so. The function of this tool is just to provide a help in trading.
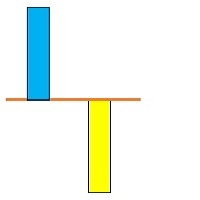
A technical Indicator Providing Price Convergence Signals along with value for experienced and professional traders. Easy to comprehend, Easy to understand.
This is a helping tool provides best signals. This indicator is designed based on the fundamentals of trade. A very good indicator you can customized its color. A best tool to find trade direction.
An adaptive indicator. It constantly adapts to the trade.
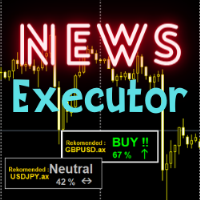
Several indicators are summarized in one display conclusion. Highly recommended indicator for all traders even beginners. You only need to make transactions according to the recommendations displayed by the indicator. It's obvious for trading news with big effects though. Trading is all about money, so love your money and make a profit with our tools. Trading recommendations on news on major currencies

Trading robot for daily profit on XAUUSD market Features: > EA will stop if it has met the daily target, and try to avoid high news , but still finish the position that is still there > scalping > hedging > averaging works with XAUUSD. Fully automatic adviser, with a system for recovering from losses. minimum balance $10 (Cent) / $1000 (STD) can use for all broker, but it is advisable to look for a thin spread and no tax contact me to get the best set file
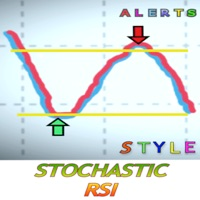
Qu'est-ce que le RSI stochastique ?
Le RSI stochastique (StochRSI) est un indicateur utilisé dans l'analyse technique qui varie entre zéro et un (ou zéro et 100 sur certaines plateformes graphiques) et est créé en appliquant la formule de l'oscillateur stochastique à un ensemble de valeurs de l'indice de force relative (RSI) plutôt qu'à des données de prix standard. Cette version inclut des alertes pour ne pas manquer de très bonnes opportunités. Vous définissez le paramètre lorsque vous souha
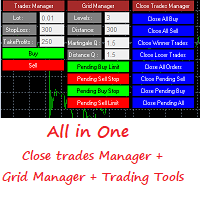
Grid Panel Allows you to : Set the number of levels (trades). Lot size and you can do Martingale to raise the lot size for each level. Set distance between levels, and you can manage the distance for each level using Distance Q. Static TP and SL for each level. You can open : BUY STOP / BUY LIMIT / SELL STOP / SELL LIMIT (levels in one click). Close all buy orders. Close all sell orders. Close all winning orders. Close all losing orders. Close all orders. Close all Pending BUY orders. Clos

Crypto_Forex Indicator HTF RVI Oscillator pour MT4, pas de repeinture. - Améliorez vos méthodes de trading avec l'oscillateur professionnel HTF RVI pour MT4. HTF signifie - Higher Time Frame. - RVI est l'un des meilleurs oscillateurs pour la détection des changements de tendance et l'entrée dans les zones de survente/surachat. - Cet indicateur est excellent pour les systèmes de trading multi-périodes avec des entrées d'action sur les prix dans les zones de survente/achat. - L'indicateur HTF RVI

Night Ghost - Indicateur de flèche pour les options binaires.
Ceci est un assistant fiable pour vous à l'avenir!
- Pas de redessin sur le graphique
-Fonctionne très bien sur toutes les paires de devises !
-Précision de l'indicateur jusqu'à 90% (surtout la nuit)
-Pas besoin de configurer pendant une longue période (configurer parfaitement pour les options binaires)
- Pas de signaux en retard
- L'apparition d'un signal sur la bougie en cours
-Parfait pour la période M1 (Pas Plus !)
- Cou

https://c.mql5.com/31/761/best-trend-indicator-logo-200x200-8493.png The indicator uses a solid line of red and green to reflect the myriad changes in market prices. The green line indicates a period of rising market prices and the red line indicates a period of falling market prices. Solid line color change indicates that the market has changed and the market is likely to reverse! It is recommended that you use this indicator on your daily K-chart. This indicator is not suitable for you to do
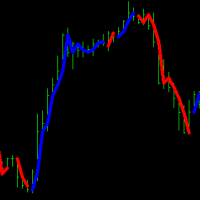
Trend indicator to determine the direction of the trend. The indicator scans the market looking for sharp price reversals and shows the trader where a bearish or bullish trend begins. When the market moves sideways, the indicator stops drawing signal lines. Thanks to this indicator, each trader is able to quickly determine the direction of the market and open the right orders in the direction of price movement. You can also analyze the market on different timeframes, confirming the signals of a

Forex Gump Trend is a universal indicator for highly effective determination of the trend direction. If you identify the trend correctly, this is 95% of trading success, because you will be able to open trades in the direction of the price movement and benefit from it. The Forex Gump Trend indicator helps traders with a high degree of efficiency to determine the current trend direction, as well as trend reversal points. The direction of the trend is shown by colored lines on the chart, and the

Shift Trend is a forex trend arrow indicator for identifying potential entry points. Determining the market trend is an important task for traders. The Shift Trend indicator implements an advanced algorithm for visualizing the market trend. Shows the opening points of transactions for sale or purchase, and also indicates the direction of the trend on: short-term and long-term periods. Suitable for trading on low timeframes because it ignores sudden price spikes or corrections in price action by

About Multiple of 5 in jap Gotobi A Gotobi is a day that has a 5 or 10 in it.
In other words, "the 5th, 10th, 15th, 20th, 25th, and 30th".
According to Japanese business custom, the demand for funds increases on Gotobi.
The middle rate is determined by banks at 9:55 a.m. on every business day (Japan Standard Time).
The exchange rate at which the bank settles the transaction on that day is the value of the exchange rate.
The higher the rate, the more profitable it is for the bank if the dollar

Welcome guys !
I offer to you this MT4 project I've been working on for the last 2 years ( roughly over 900h of work.. ).
This is a complete tool that will change the way you see MT4, because I almost recoded it entirely ! It will provides you a solid base for risk management, order positionning, hedging, account preservation and journaling.
I wanted an all-in-one panel that covers both scalping and swing trading and that suits every type of trader.
Main goal was : NO INPUTS. Never

Breakout Experts Advisor
Main strategy of this Experts Advisor is based on Daily High and Daily Low. If today's price break yesterday's high or low, this Experts will open trade. Please consider that is Experts are Martingale. But, their distance already set on the EA's program. FYI, distance for every order (on martingale) is also based on Fibonacci Retracement. It'll make every order not too close or too far. It's also help when the market are ranging/sideways. And, our maximum opened trade p
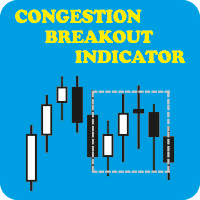
CONGESTION BREAKOUT INDICATOR: When you see a sideways price movement in a meaningless market, what goes through your mind? Is it a danger, an opportunity or completely a vacuum? Let's see if we can avoid the latter and focus on using it to our advantage. The ability to read price action through the display of rectangles on the chart could be the boost you need to achieve your trading goals. What is congestion? Congestion is a market situation where the price is trading around a particular leve
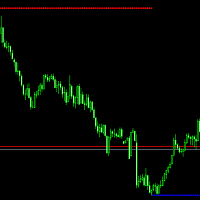
BSA indicator is a ZigZag based indicator. This indicator is used to find the reversal level of the price. You can use the existing risk ratio and calculation timeframe in the entries by optimizing them according to your usage preference. In lower time frames, the indicator can repaint. For healthier results, you can detect the least repainting by observing for a while according to the graphic you will apply.

Simple Dark Holder Tool
Arrow indicator for Forex and binary options
Already tuned for the best signals
Multicurrency and multitimeframe
Works on all currency pairs as well as raw materials, etc.
Works on the author's strategy and combines 3 indicators that show good results
Does not draw or redraw
The signal appears clearly at the opening of the candle
blue up
Red down
Alert is also built into it for your convenience.
Test and watch a video on how it works

SMART SOLDIER is a multi-currency EA, works on 9 pairs ,It can work at any broker, with any spread.
This EA has a weekly account growth of around 10% and it is a low-risk system because the bets are made only and exclusively after an accurate and studied trend research. Before opening any position, the expert checks that most of the timeframes indicate the same trend. If a trend change occurs, the expert will try to close the positions with the basket system, avoiding large drawdowns and ex
Relative Volume or RVOL is an indicator that averages the volume of X amount of days, making it easy to compare sessions volumes.
The histogram only has 3 colors:
Green - Above average volume
Yellow - Average volume
Red - Below average volume
The default setting is 20 days, which corresponds more or less to a month of trading.
With the data obtained from this indicator you can better gauge the commitment behind a move. For example, you will be better equipped to judge if a breakout of a r
FREE
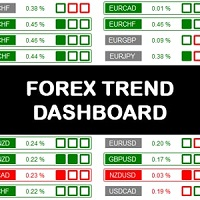
The Forex Trend Dashboard is a truly exceptional tool for analyzing and operating the choice of which exchange to try to trade. The analysis of currency baskets allows you to better understand the real situation of the market and better evaluate your own operational ideas. The dashboard analyzes the trend over different time horizons such as: daily, weekly and monthly. The resulting considerations are very simple, the session opening price and its strength condition are analyzed by recognizing t
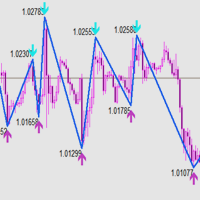
本指标 基于 Zigzag 基础上... 增加了: 1.增加了箭头指示,使图表更鲜明 2.增加了价格显示,使大家更清楚的看清价格. 3.增加了报警等设置,可以支持邮件发送 原指标特性: 1.基本的波段指标构型. 2.最近的2个ZIGZAG点不具有稳定性,随着行情而改变,(就是网友所说的未来函数) 3.原指标适合分析历史拐点,波段特性,对于价格波动有一定的指导性.
Zigzag的使用方法一 丈量一段行情的起点和终点 (1)用ZigZag标注的折点作为起点和终点之后,行情的走势方向就被确立了(空头趋势); (2)根据道氏理论的逻辑,行情会按照波峰浪谷的锯齿形运行,行情确立之后会走回撤行情,回撤的过程中ZigZag会再次形成折点,就是回撤点; (3)在回撤点选择机会进场,等待行情再次启动,止损可以放到回撤的高点。 一套交易系统基本的框架就建立起来了。 Zigzag的使用方法二 作为画趋势线的连接点 趋势线是很常见的技术指标,在技术分析中被广泛地使用。 但一直以来趋势线在实战中都存在一个BUG,那就是难以保证划线的一致性。 在图表上有很多的高低点,到底该连接哪一个呢?不同的书上画趋势线的方法
FREE
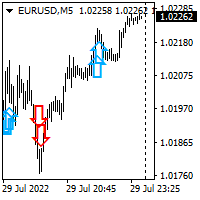
Hello all. This indicator helps you to open a trade, when break out occurred, also you can add to your position and ride it if trend continued. I use it on 1-5 min chart, as you can use short stop loss. Also profit target should be small as well. It is better to enter few small position, so you can book some profit early and ride the rest for bigger gains. Look at the past to have a plan. Enjoy.
FREE
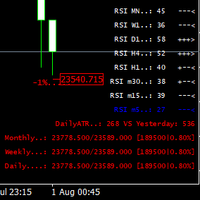
This indicator was created most for personal use. I decided to look up the last 3 bars of RSI, it is good for scalping or for weekly trading and looks as universal fx-toy. In menu you can turn on daily percentage gain info, it is good for crypto as for me, weekly and monthly gains also included as informers. Short ATR helps to determine when price was stopped and entry for pulse pump/dump. The filter of numbers of RSI can be tuned for overbought/oversold values with colors you needed. Exam
FREE
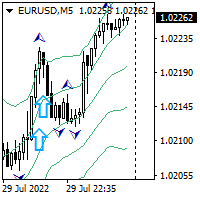
Hello all. This indicator helps you to open a trade, when break out occurred, also you can add to your position and ride it if trend continued. I use it on 1-5 min chart, as you can use short stop loss. Also profit target should be small as well. It is better to enter few small position, so you can book some profit early and ride the rest for bigger gains. Look at the past to have a plan. Enjoy.
FREE
The trade of this EA is based on Trend Following Strategy which doesn't wanna get a high price. This Ea helps us to get a lower price. Increase the opportunity of a Winning chance. EA with customizable lot size (use martingale or not), stop-loss, and take-profit levels. Easy to use and Simple Recommended Timeframe M30,H1 others timeframes with the appropriate settings. Works for ECN/Non-ECN brokers and 2-3-4-5 digit symbols A low latency vps is always recommended and An low spread broker
FREE
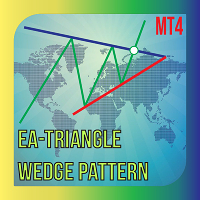
Do you know method trade use Triangle pattern , you can reference about it at link: https :// www.investopedia.com/terms/t/triangle.asp This EA help you drawing Line automatic and you can modify if you like it is a semiautomatic EA not fully automatic, only part of trading is handled by this EA. I recommend use it with high TF to get better result. Parameters: - Choose color for Support Line : Choose the Color for support line - Choose color for Resistance Line : Choose the Color for Resistan
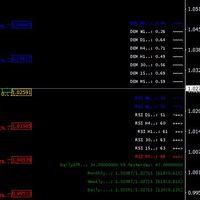
I decided to add parallel function with DeMarker to free version of my indicator with RSI MTF. it is good for scalping or for weekly trading and looks as universal fx-toy. In menu you can turn on daily percentage gain info, it is good for crypto as for me, weekly and monthly gains also included as informers. Short ATR helps to determine when price was stopped and entry for pulse pump/dump. The filter of numbers of RSI can be tuned for overbought/oversold values with colors you needed. Examp

Black friday This type of trading attempts to take advantage of speed and computing resources.
The strategy makes elaborate decisions to initiate orders based on information received electronically and which is getting better each time. For use on USDJPY only Daily . The EA takes computerization of the order flow in the financial markets of this currency. Program trades were preprogrammed to automatically enter or exit trades based on various factors of quantum mathematics calculation. The EA

Black friday
This type of trading attempts to take advantage of speed and computing resources.
The strategy makes elaborate decisions to initiate orders based on information received electronically and which is getting better each time. For use on EURUSD only Daily . The EA takes computerization of the order flow in the financial markets of this currency.
Program trades were preprogrammed to automatically enter or exit trades based on various factors of quantum mathematics calculation. Th

Black friday Another EA from the quantum series.This type of trading attempts to take advantage of speed and computing resources.
======================================================================================================================
The strategy makes elaborate decisions to initiate orders based on information received electronically and which is getting better each time. For use on GBPUSD only M15 . The EA takes computerization of the order flow in the financial markets o

This is a price action trading robot, the EA will stick to the medium term trend and price to deliver trades. Orders are always protected by the user set stop loss points. With the capital management system, it will help that EA operates in accordance with its purpose. Telegram : https://t.me/trungtqIT
Timeframe is H1. Minimum account balance: $30. Attention is Important: EA only test live on demo or real accounts. Backtest results are just random and inaccurate.
Features: Every trade is prote

Description :
A utility to create and save screenshots automatically and send to a chat/group/channel on telegram.
The saved/sent image file will include all objects that exist on the chart and also all indicators are displayed on the chart.
Features: Save screenshot of chart including all objects, indicators, ... Send screenshots to a telegram chat/group/channel
Wide range options to select when create screenshots
Logo and text adding feature
Inputs and How to setup the EA :
Various optio
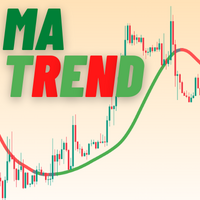
MATrend indicator makes the directional trend of the current market easily recognizable. Settings: MA Period : The amount of candles taken into consideration for the calculation of the moving average; MA Method : The method used for the calculation of the moving average. Selectable methods are: Simple averaging;
Exponential averaging;
Smoothed averaging;
Linear-weighed averaging; Usage: The color of the indcator will change based on the slope of the MA. Green : The indicator has a bullish sl
FREE

Bismillahirrahmanirrahim. More than 5 years experience in developing automated trading robots. I develop expert advisors, scripts, and custom indicators mostly for the platforms Metatrader 4 and Metatrader 5
This product use candle stick patern algo that work best on XAUUSD. there are 60 candle stick patern. If you have any question, please fell free to contact me. Best Price for first user. Thanks

Программа автоматически фиксирует часть прибыли по достижении инструментом указанной цены. - Указывается фиксируемый объем сделки - Указывается цена, на которой фиксировать - Можно фиксировать до 5 частей от объема сделки - Можно указать цену, при которой закроется вся сделка (стоп лосс) - Можно указать, при какой цене сдвигать стоп лосс и на какое значение
Long term stats is a trend indicator. As the name suggests, it computes long term running average, standard deviation and min/max values Average and standard deviation are plotted on the graph and deviation value is taken as input parameter (similarly to bollinger bands). Historical minimum and maximum are plotted on the graph and updated for each bar, considering historical time series slope. (this is to somehow account for inflation/deflation) Can be used as filter for signals, as trigger to
FREE

Hi, Arash gold expert is the first launched expert of our team intelligent trade services. The EA works only on GOLD symbol with brilliant outcome. The win rate of this expert is extremely high. And investors will gain very high profit . back-test of our expert is a proof of this claim. The Expert is very simple to use. You don't need any optimization for it, it has been already done for you. You just set EA on the chart.
The final advice; for first week, start trading with demo account.
Sym
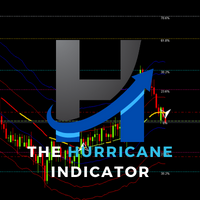
Currently switched to the 4 hour chart - but use other time frames for confirmation. :-) I change my main time frame based on the market movement at the time. The Hurricane Forex Indicator is a multi time frame indicator that includes such things as Trade Notifications, Trade Calculator, Momentum Indicator, risk reward and much more. We have a free Trade room for our users as well. Please check out the video for full details of how this indicator works as it has over 15 years worth of developme
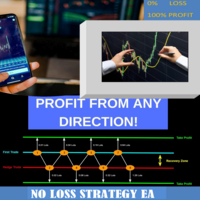
The NO_LOSS_STRATEGY_EA is the EA that is not accepting loss by hedging the position of trade direction, it doesn't matter what direction the market will go if the market goes up it will hit the take profit or when the market will go down it will also hit the take profit by regulating the amount of lot size used, in the end, the trades will close in total profit. The EA is suitable to trade on all pairs but the most tested pairs and is very suitable for a good profit are GBPJPY, GBPUSD, USDJPY,

Welcome to Upside Down !
Upside Down is a powerful indicator that gives the perfect trading opportunities and a clear indication of the market. Upside Down has been created to be as simple as possible. Arrows are calculated based on ASC Trend and customs indicators . Signals appear without delay at the end of a candle, if it has tested the level. The signals do not overdraw.
THE BENEFIT:
Easily to enter in buy position/sell position Intuitive directional arrows by colors

Universal Breakout est un expert advisor simple et flexible pour trader les cassures de range sans complexité inutile. Vous définissez l’intervalle de temps — l’EA identifie automatiquement les niveaux, place les ordres et gère la position. Universal Breakout Advisor User Guide >> Download COMMENT FONCTIONNE LA STRATÉGIE DE BREAKOUT DE RANGE
La stratégie de breakout repose sur une logique simple : lorsque le prix sort d’un range formé, cela entraîne souvent un mouvement fort. Le range peut ê
FREE

The Cat Trend VZ-un indicateur constamment amélioré avec des signaux d'entrée précis et rentables.
La ligne de l'indicateur The Cat Trend VZ change de couleur en fonction de la direction de la tendance, et aux points d'inversion des prix, l'indicateur dessine des flèches.
En outre, l'indicateur The Cat Trend VZ a mis en œuvre une alerte sonore et textuelle sur l'apparition d'une flèche.
IMPORTANT: L'INDICATEUR N'EST PAS REDESSINÉ.
Principales caractéristiques de The Cat Trend VZ: Fonct
FREE

Gold Buster M1 System est un système de trading professionnel pour les graphiques M1 sur la paire XAUUSD. Mais, malgré le fait que le système a été développé à l'origine exclusivement pour le commerce de l'or, le système peut également être utilisé avec d'autres paires de devises. Après l'achat, je vous donnerai une liste de paires de trading pouvant être utilisées avec le système en plus de XAUUSD, ce qui élargira vos possibilités d'utilisation de ce système. TOUS LES INDICATEURS DU SYSTÈME NE

Gorilla Channel VZ est un indicateur de canal développé sur la base de nombreuses années d'observations.
Un indicateur de trading de signaux peut être utilisé à la fois comme indicateur d'affichage d'un canal de tendance et comme l'une des sources de signaux d'entrée, sous réserve d'un filtrage supplémentaire. Avec une approche appropriée, au moins 80% des transactions réussies.
Principales caractéristiques de Gorilla Channel VZ: Fonctions analytiques
Peut être utilisé sur toutes les paires
FREE

Panda Oscillator - un nouvel indicateur de l'auteur conçu pour le scalping.
L'indicateur donne des signaux basés sur les lectures d'un ensemble d'instruments standard et de droit d'auteur.
Principales caractéristiques de Panda Oscillator: Fonctions analytiques
Peut être utilisé sur toutes les paires de devises et les trames temporelles; L'indicateur n'est pas redessiné; Excellent ajout à d'autres indicateurs; Capacités graphiques
Prend le nombre minimum d'espace sur le graphique; Teinture
FREE

Gorille blanc
Gorilla fonctionne sur STDEV, RSI, Envelope, Pbsar, Ichimoku et Moving Average. L'EA fera le Stratégie MARTINGALE pour augmenter le pourcentage de profit. De plus, cet EA peut être utilisé pour le commerce manuel en cliquant sur le bouton d'achat ouvert ou de vente ouvert et en ajustant la taille du lot par vous-même.
Découvrez les performances de mon robot https://www.mql5.com/en/users/daffasukma22/seller et lisez mon guide ici PM moi si vous êtes confus à pr
Binaripex est un indicateur pour les options binaires. L'indicateur montre avec une flèche sur le graphique dans quelle direction le prix ira dans un proche avenir. D'après nos statistiques, dans 95% des cas, le prix dans un avenir proche (de 1 à 5 minutes sur de petits délais) ira au-dessus ou en dessous de l'indication de la flèche. Cela vous permet d'utiliser cet indicateur avec une grande efficacité pour le trading d'options binaires. De plus, l'indicateur sur le graphique indique près de c
AverageDirectionalIndex - formule d'indicateur améliorée. Cette version d'ADX détermine beaucoup plus précisément les points d'inversion des prix et la direction de la tendance actuelle. De plus, à l'aide de cet indicateur, vous pouvez déterminer la force de la tendance. Lorsque la ligne verte croise la ligne rouge de bas en haut, cela signifie que la tendance est à la hausse ou qu'un recul temporaire se forme. Lorsque la ligne rouge croise la ligne verte de haut en bas, cela signifie que la te
This program will make analysing multiple timeframes more convenient.
It will help to sync all charts in a different Timeframe sync charts to show same symbol, same specific time period and sync drawing objects Show on all charts at the same time
How to use it >> https://youtu.be/NEHUW7v1h1c In this edition there are only 6 object types that can be synced all chart. Drawing Object Type Support : Vertical/Horizontal Line, Trendline, Rectangle, Arrow, Fibo-Retracement
Additional Feature: T
FREE

This indicator is very usefull to TRADE Trading Ranges and helps identify the following TREND. Every Trader knows that any market stay 80% of the time in trading ranges and only 20% of the time in TREND; this indicator has been built to help traders trade trading ranges. Now instead of waiting for the next TREND, You can SWING TRADE on trading ranges with this simple yet very effective indicator.
TRADING with CONGESTIONI INDICATOR:
The CONGESTIONI Indicator identify a new trading range and ale
Fixation Trend indicator showing buy and sell areas. The indicator follows the price movement, works at the opening price. It also displays information about the trend following the breakout of the minimum and maximum. The indicator has very simple but effective graphics: above the opening price, an orange dot is displayed - a sell signal, below the opening price - blue, a buy signal. The indicator also accompanies the signals with a sound alert and a pop-up window notifying the signal on the op
Are you tired of the constant ups and downs? Do not become a victim of unstable market movements, it's time to get rid of it somehow! Already now you can use The Trend Setter solutions to balance the price movement analysis and get a clearer picture of the price action.
The Trend Setter is a trend indicator for the MetaTrader 4 trading platform. If you don't have your own trading strategy yet, you can use our ready-made trading strategy. The indicator will help in finding entry points when ana

Polynomial Trend - A tool that allows you to determine the direction and strength of a trend. Unlike most indicators, Polynomial Trend finds longer-term trends and gives fewer false signals. This indicator allows you to find the most likely trend reversal points b allows you to identify the current market phase (uptrend, downtrend).
This indicator displays arrows of different colors depending on the current state of the market and thus signals the user about a change in trend. It is easy to us

What are "pivot points"? Pivot point analysis is often used in conjunction with the calculation of support and resistance levels, as is the case with trend line analysis. Pivot point analysis calculates the first support and resistance levels using the trading range width between the pivot point and the previous day's high or low price. The second support and resistance levels are calculated using the entire width between the previous day's high and low prices.
Looking for a quality pivot poin
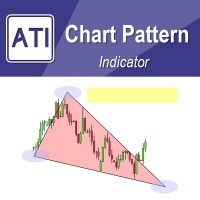
Introduction to Chart Pattern MT Chart Pattern MT is a chart pattern scanner to detect the triangle pattern, falling wedge pattern, rising wedge pattern, channel pattern and so on. Chart Pattern MT uses highly sophisticated chart pattern detection algorithm. However, we have designed it in the easy to use with intuitive user interface. Chart Pattern MT will show all the patterns in your chart in the most efficient format for your trading. You do not have to do tedious manual pattern detection an

The Mechanism Trend indicator is a hybrid indicator that shows the moments for entering the market with arrows. This indicator was created on the basis of the original indicators for searching for extreme points, the indicator is well suited for determining a reversal or a large sharp jerk to one side.
When the trend changes, the Mechanism Trend indicator uses color signaling: green - when changing from a downtrend to an uptrend, and red - vice versa, to a downtrend. You can use the indicator
Le MetaTrader Market est le meilleur endroit pour vendre des robots de trading et des indicateurs techniques.
Il vous suffit de développer une application pour la plateforme MetaTrader avec un design attrayant et une bonne description. Nous vous expliquerons comment publier votre produit sur Market pour le proposer à des millions d'utilisateurs de MetaTrader.

Vous manquez des opportunités de trading :
- Applications de trading gratuites
- Plus de 8 000 signaux à copier
- Actualités économiques pour explorer les marchés financiers
Inscription
Se connecter
Vous acceptez la politique du site Web et les conditions d'utilisation
Si vous n'avez pas de compte, veuillez vous inscrire