适用于MetaTrader 4的新EA交易和指标 - 184

The strategy of the Expert Advisor is based on one of the strongest signals of technical analysis - Engulfing .
When determining this figure, a trading expert studies the current market situation and, if there is a combination of certain factors, starts working.
It is recommended to start working with a small trading lot . As you become familiar with the work of an expert, the trading lot can be increased (use money management) to a psychologically acceptable size.
Attention : the format

A unique trading strategy is based on controlling trading volumes at various levels of volatility. The trade expert automatically determines the zones of purchases and sales and the degree of mathematical probability of successful forecasting of each transaction. If there are sufficient conditions and a high degree of probability of profit, the adviser starts work. Hazardous trading methods are not used. Each trade is protected by stop loss. Profit control is carried out by a special strategy f
Price Alert Indicator FREE
Description:
Configurable price alert indicator for when the price crosses upwards or downwards.
Characteristics:
It can be configured one-way, or both ways.
Horizontal lines are used to indicate the level to which you want to be alerted.
On-screen buttons to hide or show the lines.
Alerts:
MT4 alert.
Push alert to mobile phone.
FREE VERSION ONLY WORKS ON AUDUSD PRO VERSION: https://www.mql5.com/es/market/product/53040
FREE

Ophiuchus is the 13th zodiac and it is also the name for this EA as 13 is the key elements for this trading strategy. Trading Strategy
The following are the main characteristic of this EA. Martingale based strategy. Only open more trades when it is on the right direction. earn small profit for each trades but a lot of volume everyday. Profit from the volatility of the market. Tested and Proved to be able to profit on EURUSD trading with M1 timeframe. Back Test Result
Back test result are

The Dawn Trend indicator is not prone to redrawing or any other type of erroneous display. Sharp price fluctuations, as well as noise around average prices, are ignored.
Perhaps, trend indicators can be called the main ones, since classic trading involves looking for trends. Many classics of trading in financial markets have developed their systems specifically to search for market trends.
This indicator embodies the implementation of a trend indicator. Which fixes a certain direction of ch
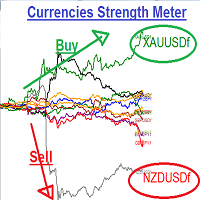
Currencies Strength Meters
:::: It is programmed to work on any M5 Chat windows !! Used to determine the Strongest currency pairs and the Weakest pairs also detect the peak of deviation of currencies strength IT CAN BE USED FOR INDICES AND STOCKS TOO !! Strategy one : It can be used in to BUY Strongest pair and SELL Weakest one Strategy two: It can be used on Daily basis to Hedge BUY Strongest pair with high % (ex: +1%) and BUY Weakest one with % lower(ex: -0.7%) the same with SELL Strategy
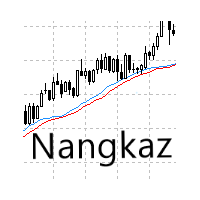
Technical analysis based on indicators Moving Average, ATR, Candle bar and Volume.
From manual trading to auto trading.
Sometime win, sometime loss too..
prefer frame time M1
Conditions of Generation of Signals Buy
1. Close prices of the analyzed bar is above the Slow Moving Average indicator.
2. Fast Moving Average indicator is above the Slow Moving Average indicator.
3. Volume value of the analyzed bar is above X.
4. ATR value of the analyzed bar showing rising.
5. Price close of th

Hello This Indicator will draw Green (Up) and Red (Down) small arrows from Multi TimeFrames based in ( RSI ) to help you to take decision to buy or sell or waiting If there 4 green arrows in same vertical line that's mean (Up) and If there 4 Red arrows in same vertical line that's mean (Down) and the options contain (Alert and Mobile , Mail Notifications). Please watch our video for more details https://youtu.be/MVzDbFYPw1M and these is EA for it https://www.mql5.com/en/market/product/53352

Hello This Indicator will draw Green (Up) and Red (Down) small arrows from Multi TimeFrames based in ( Ichimoku ) to help you to take decision to buy or sell or waiting If there 4 green arrows in same vertical line that's mean (Up) and If there 4 Red arrows in same vertical line that's mean (Down) and the options contain (Alert and Mobile , Mail Notifications). Please watch our video for more details https://youtu.be/MVzDbFYPw1M and these is EA for it https://www.mql5.com/en/market/product/533

Smart Trendline Order is an EA to set pending orders using Trendline from your chart. Main Features: 1 . Create Invisible or Visible pending order. Visible pending order means, it will open BuyLimit/SellLimit/BuyStop/SellStop and update the OpenPrice along the Trendline. 2 . Identify BuyLimit/SellLimit/BuyStop/SellStop if you change line direction above or below running price. 3 . Delete previous pending order and open new pending order if you change line direction above or below running price.

Indicator without redrawing Divergent MAX The DivirgentMAX indicator is a modification based on the MACD. The tool detects divergence based on OsMA and sends signals to buy or sell (buy|sell), taking into account the type of discrepancies detected.
Important!!!! In the DivirgentMAX indicator, the optimal entry points are drawn using arrows in the indicator's basement. Divergence is also displayed graphically. In this modification of the MACD, the lag problem characteristic of its predecessor

The Expert Advisor identifies the most probable direction of the price based on the divergence of volumes and consolidation of prices in the overbought/oversold areas. Filtering for opening trades is carried out by using a unique formula for calculating the price level - "magnet" (based on the Ichimoku indicator), where the price is highly probable to come within a few bars in the future. The EA contains a minimum of settings, which facilitates its usage. Recommended symbols: EURUSD 15m ; GBPUSD
Price Alert Indicator PRO
Description:
Configurable price alert indicator for when the price crosses upwards or downwards.
Characteristics:
It can be configured one-way, or both ways.
Horizontal lines are used to indicate the level to which you want to be alerted.
On-screen buttons to hide or show the lines.
Alerts:
MT4 alert.
Push alert to mobile phone.

The Expert Advisor identifies the beginning of a wave movement and starts working according to the direction of the new wave. It uses tight stop loss and take profit. Built-in protection against spread widening. Control of profit is performed by the tight trailing stop feature. Lot calculation is based on stop loss. For example, if stop loss is 250 points and MaxRisk = 10%, the lot size will be calculated in such a way that triggering the stop loss would lead to a loss equal to 10% of the deposi

The trading expert "Space Reptile" was developed on the basis of three trading strategies that were tested on PAMM accounts and showed high performance.
Algorithms for determining the phases of a trend direction allow a trading expert to accurately enter the market in the right direction.
The built-in profit and loss control mechanism ensures stable profit superiority over losses.
Each transaction is accompanied by a mandatory stop loss and take profit.
The expert’s strategy does not pr
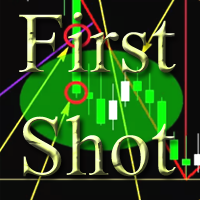
The Expert Advisor is a trend scalper. The martingale is not used. The strategy is based on defining the volatility level change as compared to a certain time period in the recent past. When a price movement becomes unusually active within a certain time period up to this point, the EA begins its work. A simple Moving Average serves as a movement direction filter. The EA settings allow limiting its operation during spread and slippage expansions. A trading lot is calculated depending on a stop

Planned Channel is a non-repainting channel indicator based on moving averages. The Planned Channel takes into account not simple moving averages, but double-smoothed ones, which, on the one hand, makes it possible to more clearly determine the market movement, and on the other hand, makes the indicator less sensitive. The key difference between the Planned Channel indicator and other channel indicators (for example, from the same Bollinger) is that the indicator displays more valuable signals f

The EA uses a unique non-linear formula for calculating market entry points and a unique algorithm for fixing the result of work.
The trading expert does not use the increase in the volume of transactions to block unprofitable positions.
Mandatory take profit and stop loss levels are used. Support: https://www.mql5.com/en/channels/TrendHunter The adviser controls the spread increase by the broker and skips trading until the spread returns to its "normal" values.
The best results are achie

All the points of intersection of the Troopers indicator will be points at which the trend direction changes. Sharp price fluctuations are ignored as well as noise around average prices. Signal points, where the color changes, can be used as potential market reversal points. The indicator tracks the market trend with very high reliability. This development can be used both for long-term trading and for pipsing on small periods. The indicator algorithm implements a kind of technical analysis base
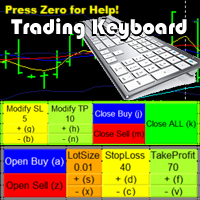
Trading Keyboard Tool will enable you to: Easily OPEN/CLOSE/MODIFY orders with Keyboard and with Buttons on Screen. Modify Order parameters with shorcuts.
Export different Prices into a file for analysing outside MT4. Save Chartscreen into an image. Show Fibonacci on screen with shorcut.
You can export these Prices into files:
COHL : history of Close,Open,High,Low in one file.
Close - history of Close in one file. Open - history of Open in one file. High - history of High in one f
FREE

Rebalance Overlay Technology (Rebolt) enables the trader to visualize the flow of money from one chart to another chart. Rebolt Delta (ReboltDelta) indicates the probable price change that will occur in the target chart based on changes in the source chart. ReboltDelta is designed for use in cooperation with Rebolt Probability. La tecnología de superposición de reequilibrio (Rebolt) permite al operador visualizar el flujo de dinero de un gráfico a otro gráfico. Rebolt Delta (ReboltDelta) indica

Script to create arrows and lines on chart of history positions traded on account for the symbol where you launch the application. From inputs you can select: - Magic number (default is -1; -1 = all magics number) - "From" date and time (default is 1970.01.01 00:00; all positions) - "To" date and time (default is 1970.01.01 00:00; all positions) - Color for buy open positions (arrows and lines between open and close) - Color for buy closing positions (arrows) - Color for sell open positions (arr
FREE

This indicator is an utility for have always under control, how much time is left at the end of the bar setted.
The utility show on the lower right of the chart, the countdown to the end.
When the remaining seconds is = to the seconds set in the input, the color of remaining seconds on chart, change color and play a warning sound to warn you that the bar is about the end. When the remaining seconds is < to the seconds set in the input, the utility play a beep to warn you that the bar is in
FREE

Utility for show on charts the visual informations about: - a vertical line at start of each bar of selected timeframe - a vertical line at start of each day - a vertical line at start of each week - vertical lines at start / end of trading sessions selected - bid / ask prices, spread, money value for each point (of 1 standard lot) and last tick time recived" You can enable / disable each information and set the color for each line
FREE

Utility for know all informations and settings of terminal where the utility is loaded. The informations that you can know are for example:
- The path of folder where the terminal start
- The path of folder where the terminal store the indicators, experts advisors etc
- The path of common folder
- The permission to use DLL, to automated trading etc
- The permission to send email, FTP or notifications to smartphone
and many other informations
FREE

Script to load on chart the orders, starting from "Signal history report" downloaded from MQL5. If you found a good signal on "Signals" section of this site and you want to see the history orders on chart, you can do it, following this steps: - Download the csv file of history orders - Copy file in the common folder - Launch the script and set the input that are: - Report type (MT4 or MT5) - File name - Delimiter (default is ;) - Name of symbol to load (if symbol on file is for example EURUSDi,
FREE

Utility for know all informations and settings of account where the platform is connected The informations that you can know are for example:
- The difference from server time and time of your PC
- The limit orders that you can place at market
- The credit that you have
- The stopout mode of your broker
- The exact name of company of your broker
and other informations
FREE

Script to calculate equity and balance at a specific date and time.
This script makes up for a lack of MetaTrader account history, that does not show how the balance and equity changes in time.
Balance calculation includes closed orders only.
Equity calculation includes orders closed before and orders that are still open at the specified time.
Example: date and time set to 2020/07/06 00:00. If I had a Buy 1 lot EURUSD position opened at price 1.12470 on the 2020/07/02, the program woul
FREE

Utility for know all informations and settings of all symbols available on your broker The informations that you can know are for example:
- Spread
- Digits
- Tick value
- Size step
- Size minimum
- Size maximum
- Swap buy and sell
- Margin required (for 1 standard lot)
- Rollover day
- Execution mode
and many other informations You can filter the symbols by group or you can also choose to see the informations only of symbols available on market watch.
FREE

Our most popular indicator in our fleet of indicators. The POWR Trend Trader is the highest grossing manual strategy for trading on the market today. This indicator is upgraded with more Profit Points and also introduces Re-Entry alerts. The POWR Trend Trader (PTT) is our premier indicator! What this indicator can do for your profits is staggering! HOW TO USE The POWR Trend Trader has a Master Trend Meter at the bottom of the chart. We actually re-coded the main indicator that turns your candle

For sure, this indicator has become very popular amongst traders. Through coding this indicator will give you the most accurate levels possible for your trading analysis. We have also added in the ability for you to receive alerts when the price breaks above or below a Support or Resistance lines! HOW TO USE The red rectangles represent your resistance/supply zone. The green rectangles represent your support/demand zone. BONUS FEATURES We coded this indicator with the ability to switch between
Don’t overlook the power of this indicator. We took the time to find the best algorithm to pull the best momentum lines in the industry. We also coded in the orange stream to give you a quick glance at where the overall trend is heading. This indicator works incredibly well for Stocks, Forex and Crypto! HOW TO USE When the orange stream is heading down, this means you are in a strong downtrend. When the orange stream is heading up, this means you are in a strong uptrend. When the red lines start

For trading, the support and resistance lines for current price are everything. With the ability to adjust sensitivity, this indicator delivers just that! HOW TO USE The blue lines represent the most relevant support and resistance for the current price. You can adjust the sensitivity of the support and resistance lines by adjusting the input value under the indicator settings to show more or less support lines.

Key Levels + Zones
Indicator cleanly displays even numbered price levels: “00s” and “50s” . Additionally, you can display “Mid-Lines” which are preset distance levels on both sides of the even numbered price levels (set to 12.5 pips by default). This 25-pip zone that straddles each even numbered price relates to where many traders place their stops and therefore can be a risk “Zone” to steer clear of when placing your stops. The zone also acts as support and resistance. Indicator p rovid

Utility for know the performance of your acoount. From dialog you can filter data in this modes: - You can include or not include the open positions
- You can include or not the closed positions
- You can filter the data by date (from, to)
- You can filter the data by simbols (multi selection)
- You can filter the data by magic number (multi selection) On bottom of table, are show the total of: - Number of data
- Total size
- Total commissions paid
- Total swap paids
- Total profits
- T
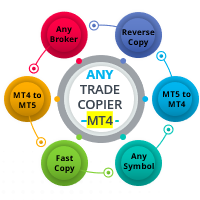
Ready to save big? All items are $30 for limited period.
Fast, Reliable, and Any (broker or symbol) to Any (broker or symbol) Trade Copier Solution. The Copied trades will be having your custom comments: Its very common problem in existing copiers that if symbol names are totally different in Master (Provider) and Slave (Receiver) Account then the existing copiers doesnt work. In this copier you will not face such issue and you can copy any symbol name to any symbol name. For Example: Your

Hello trader,
I'm a fan of Price Action and i coded my indicator named Price Action Candle. May be future it is a paid version that can be get alert by mobile phone or telegram. This indicator can show you three type candles as: PinBar, Inside Bar and Fakey. You can setup more option for other candle: Engulfing
Feel free to contact me in a private message or via telegram @spotXXX
Thanks and happy trading!
FREE

By default Metatrader will show any newly created chart object on all timeframes.
This handy utility will set the visibility of any new chart object drawn to be that of the current chart only.
e.g. If the chart timeframe is H4 then a new object will only be visible on the H4 timeframe.
Each object type can be included or excluded as required and, of course you can change the timeframes setting afterwards as this only operates at the point the chart object is created.
Add to your chart a
FREE

BB RSI Robot is made for any level of users: Beginners can use it as it is, Experts can fully customize it.
Bollinger Bands and RSI based algorithms for autotrading: it follows 3 Bollinger Bands and RSI levels and places orders with all values computed when the algorithm gives a green flag. Order values use algorithms for risk management per trade and pips calculator. Each placed order is closely followed to be modified if more accurate Take Profit value is computed.
BB RSI Robot is f

Dollar mint indicator is a special workmanship with years of experience in forex.
Dollar mint ea is a fully non repaint indicator optimised with price action data such that once it gives you a signal t . The indicator can be used to trade anything on the mt4 with much ease.
Benefits ;
Fully non repaint Use in any timeframe Use in all the available tradable assets on mt4
Best to use on h4. It generates fully analysed buy and sell signals based on trend and also filters out retracement
Are you tired of drawing Support & Resistance levels for your Quotes? Are you learning how to spot Support & Resistances? No matter what is your case, Auto Support & Resistances will draw those levels for you! AND, it can draw them from other timeframes, right into you current chart, no matter what timeframe you are using...
You can also Agglutinate regions/zones that are too much closer to each other and turning them into one single Support & Resistance Level. All configurable.

Sprout
Можно начинать с небольшого депозита.
Отличный вариант для разгона депозита.
Для мультивалютной торговли.
Невосприимчивость к большой задержке и величине спреда.
Принцип работы
После запуска на графике запоминает уровень открытия первого ордера.
Выше уровня открытия первого ордера, выставляет сеть ордеров на Sell.
Ниже уровня открытия первого ордера, выставляет сеть ордеров на Buy.
Если общая прибыль ордеров на покупку и на продажу превышает значение параметра Profit,

Summer 40% discount ($149 -> $88) Everything for chart Technical Analysis indicator mt4 in one tool Draw your supply demand zone with rectangle and support resistance with trendline and get alerts to mobile phone or email alert - Risk reward indicator Video tutorials, manuals, DEMO download here . Find contacts on my profile .
1. Extended rectangles and trendlines Object will be extended to the right edge of the chart when price will draw new candles on chart. This is rectangle extend

该指标在图表上显示圆形水平。 它们也被称为心理、银行或主要参与者级别。 在这些水平上,多头和空头之间存在真正的斗争,许多订单的积累导致波动性增加。 该指标会自动调整到任何工具和时间范围。 当80水平被突破然后测试时,我们买入。当20级被突破然后测试时,我们卖出。目标是00。 注意力。由于强大的支撑 。 和阻力位,价格可能略低于 00 水平。
输入参数 。
Bars Count - 线条长度(以条为单位) 。 Show 00 Levels - 显示或不显示 00 级 。 Show 10, 90 Levels 。 Show 20, 80 Levels 。 Show 30, 70 Levels 。 Show 40, 60 Levels 。 Show 50 Levels 。 N Lines - 限制图表上级别数的参数 。 Distance 00 Levels - 层间距离(自动或手动) 。 Line Position - 图形前面或后面的线 。
Visual Button - 按钮显示(启用/禁用) 。 Corner - 按钮锚定角
FREE
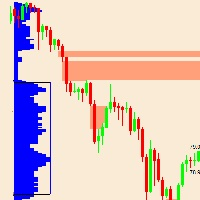
MT5 : https://www.mql5.com/en/market/product/53385 该指标基于市场概况理论。 单打区到底是什么? 理论:市场概况单打: 轮廓的单张或单张打印或间隙放置在轮廓结构的内部,而不是上边缘或下边缘。 它们以在市场资料上打印的单个TPO表示。 单身人士将我们的注意力吸引到价格快速波动(冲动)的地方。它们使低交易量的节点留有流动性缺口,从而导致市场失衡,并向我们展示了失衡的区域。通常,当市场对意外消息做出反应时,会创建单个。这些报告能够引起极端的失衡,并为买方和卖方的极端情绪反应做好准备。 市场将希望重新访问该区域,并检查这些价格水平是否不是对以这些价格进行交易感兴趣的交易者。这些商人为什么要在那里?因为市场从字面上飞过该地区,只有少数交易者有机会在该地区进行交易。为此,将来可能会填补这些领域。 这些低效的举动往往会被填补,一旦它们被填补,我们就可以寻找交易机会,或者我们也可以在它们被填补之前进入,并使用这些单张图作为目标。 用作支撑/阻力区域,但并非总是要小心。通常,它在趋势日表现良好。请参阅市场概况日:趋势日(策略1-买入-第三张图)和具有双

Currency Strength Meters are a great way to identify strong and weak currencies. With this CSM indicator attached to your chart, you will get a clear overlook over the 8 major currencies: USD, EUR, JPY, CAD, CHF, GBP, AUD, and NZD.
Suggested timeframes to scan is: M15 - H1 - H4 - Daily You can however just change timeframe to check in the settings. Bear in mind that scanning very low timeframes such as M1 will require a lot of resources and might make your mt4 terminal slow.
The strength s
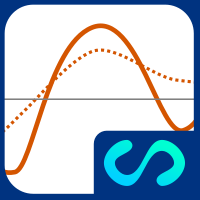
线性回归的斜率值表示。它具有一个参考图,可以直观地确定斜率值的变化(价格的加/减)。
参数
•Periods:计算线性回归的周期数
•PeriodsReference:根据主图的值计算移动平均线的周期数
•Displacement:水平轴上的位移
•AppliedPrice:进行计算的价格
•MainPlot:显示主图
•ReferencePlot:显示参考图
使用建议
•使您可以轻松查看当前价格趋势。如果MainPlot大于零,则趋势为正,如果小于零则趋势为负。
•它可以轻松直观地看到斜率的变化(价格的加/减)。如果MainPlot高于ReferencePlot,则价格正在加速,如果低于,则价格正在减速。
•非常适合于摆动交易或高速交易。
•确定交易主要方向(买/卖)的理想选择。
•它不提供有关价值区域(支撑,阻力)的直接信息,因此最好将其与价格指标(例如移动平均线或线性回归带)配对。
•当MainPlot穿越零时,提供有关市场反应区域(支撑,阻力)

Excellent Multiplatform Copier of deals. I use it regularly on VPS (copy from Mt5 to Mt4).
Multiplatform : copying from MetaTrader 4 to MetaTrader 4; copying from MetaTrader 4 to MetaTrader 5; copying from MetaTrader 5 to MetaTrader 4; copying from MetaTrader 5 to MetaTrader 5.
Modes: master - the current terminal is source of trades (deals are copied from it); slave - the current terminal is the receiver of trades (trades are copied to it). from myself - mode "deals
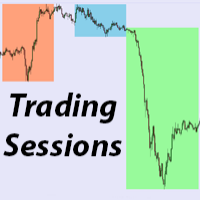
Trading Sessions 3
Description
Display the intra-day trading sessions from ASIA , LONDON and NEW YORK ASIA Session : Most volatile currencies AUD , NZD , JPY LONDON Session : Most volatile currencies GBP , EUR NEW YORK Session : Most volatile currency USD Inputs
Modifiable trading hours as HH:MM format
Custom days to display sessions
Note : GMT+3 = Helsinki Timezone
FREE

Great dashboard for market analytics. The panel helps to analyze the values of the Envelopes indicator and prices.
Using this panel you can: watch the current signal from Envelopes for all time frames; watch the current signal from Envelopes by different symbols; look at how far Envelopes is from the price; look at how much the value of Envelopes has changed; several types of signals for analytics.
Values in the table cell: Envelopes value upper line; Envelopes value lower line;
"the

Aussi Trader ======================================
The Robot is based on 6 Indicators to catch profitable trades. ==========================================
This Robot is fully automated and has been created for everyone. The Robot works also on cent accounts. =============================================================================================== => works on all Time Frames from 1Minute to 1Day => On the lower Frames there are too many small trades but its up to yourself. => I wo

Introduction to Fibonacci Volatility Indicator Volatility indicator can help you to detect any statistical advantage for your trading. Especially, if you are trading with Price Action and Price Patterns, then we recommend to use the Volatility indicator together with your strategy. Especically, Fibonacci Volatility indicator combines the market volatiltiy with Fibonacci Analysis to provide you more advanced volatiltiy indicator. Main Features Fibonacci Volatility in Z score Configuration Mode Fi

The advantage of the expert Advisor is that it only works on finding the best point to open a trade, immediately sets a fixed stop loss and take profit, and then does not perform any manipulations with orders. Orders opened by the expert Advisor do not depend on each other (martingale, top-UPS, locking and arbitrage are not used). With this approach, the adviser does not require a constantly enabled terminal, you should not be afraid that something will happen to open trades if its settings sudd

HUBBLE it is a Secure Automated Software for trade Forex market and indices.
The architecture is a Fully Automatic Autonomous Robot Expert capable of
Independently analyzing the market and making trading decisions
HUBBLE It is an advanced trading system. This is a fully automatic Expert Advisor. HUBBLE It is a 100% automatic system, The system is self-sufficient, performing all the work. Is a revolution in the customization of the trading. You can download the demo and test it

Due to policy changes in MQL5.com, we cannot continue our free trial program here. However, you can request to test our EA in live account though here . Ophiuchus is the 13th zodiac and it is also the name for this EA as 13 is the key elements for this trading strategy. Trading Strategy
The following are the main characteristic of this EA. Martingale based strategy. Only open more trades when it is on the right direction. earn small profit for each trades but a lot of volume everyday. Profit
FREE
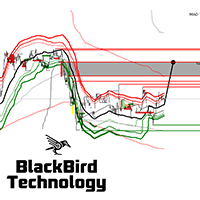
Ultimum Signal Indicator contains the most powerful buy,sell and exit signals. They can all be be separately turned on/off, so you decide what to display on the chart ! This is my ultimum inidicator that is a no-nonsense, no delay, no repaint indicator ! Signals : Target price levels :
Liquidity Pools (Liquidity voids, major supply/demand zones, and price discrepancies) Liquidity Pools Forecast Projection Market Reversals :
Reversal Blocks Pinbar groups Trend and mastertrend slowdowns (indicat

Orions , an Expert Advisor, has implemented the best algorithms for trading from scalping and pipsing: filtering deals using the Gann and Elder methods from different time intervals when trading price momentum patterns from 5-minute charts of the instrument. This robot makes a lot of trades every month and filters out each of them using powerful analytical tools, but it is impossible to open so many trades per year and still not get a single losing day. If you do not agree with this, do not buy
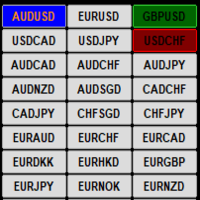
This indicator display current profit/loss status for each pair visually on a single chart. If the current open chart pair is selected and a trade/s are opened for that pair only the Symbol name is highlighted and the button color reflects the current trade/s status if the selected chart pair does not have any open trades then the button color is Blue. The input options are :
1/ Select Pairs automatically from the Market Watch
2/ Manually select your own Pairs
3/ Select all MT4 Timeframes

The utility is designed to close and delete positions when the specified loss/profit values are reached in the currency/percentage of the Deposit. The chart displays a panel with information: profit/loss on the account, the number of open positions, and total positions in lots. Parameters: SHOW THE DASHBOARD - TRUE - Yes, FALSE - No. CURRENCY PAIRS - TRUE - All, FALSE-Current. STOP PROFIT IN $ OF THE DEPOSIT - Profit value in the Deposit currency. STOP LOSS IN $ OF THE DEPOSIT - Loss value in
FREE

Introduction
This will calculate the risk taken only on EURUSD on going trades (both market order or pending) in dollar or euro. The risk is depending upon the lot size and stoploss you choose for the trade. Trades it consider
Only EURUSD Types of Trades
Direct Market order Pending Trades Please note Customization is also available for the function. For more details feel free to contact.
FREE

Ultimate pattern builder Scanner (multi time frame and currency pair)
Allows you to build any pattern with up to 3 candlesticks. This Scanner is basically indicator with scanning feature, you can now create your own candlestick patterns and scan them in real time at any time frame and currency pair (stocks, energies, crypto...). Now you can use full potential of indicator in real time trading. If you dont know yet what is so special about this ultimate pattern builder software collection: it

The Pushing Trend indicator implements a kind of technical analysis based on the idea that the market is cyclical in nature. The indicator tracks the market trend, ignoring sharp market fluctuations and noise around the average price. It fixes the trend and shows favorable moments of entering the market with arrows. AND
Working with the Pushing Trend indicator is quite simple. Look at the arrows and determine the direction of work. The indicator can be used not only to fix the trend direction

The Trend Priority indicator can be used for both short-term pips and long-term trading. Works on all currency pairs and on all timeframes. When using it is recommended to look at the additional indicator of a filter of possible false signals.
Indicator shows signals for input. Displays both entry points and the trend itself. Shows statistically calculated moments for entering the market by arrows. When using the indicator, you can optimally distribute the risk factor.
Settings: Uses all on

RealProfit Expert works on currency pair USDJPY only! The Expert doesn’t use any additional indicators to open transaction. Trade is based on important levels breakthrough. The Expert has minimum quantity of parameters, for this reason it is ready for work immediately after it has been installed. The absence of additional parameters provides the possibility to use the Expert easily even by beginners. The Expert is suitable for long term investments over 1 year. You should take into consideratio

Introduction
What should be the Lot Size of our next trade ? is a very common and an important question. We don't want to burn our account by placing higher lots or neither want less profit by placing small lots even when we have capacity to place a reasonable lot size. The Risk Lot Calculator is a simple and efficient small tool that will assist your trading and help you choosing lot size by risking your account balance of your own choice. It will tell you how much lot size will risk your ho

Angry Bull Option Binary
This is a Binary Options robot, which contains 7 strategies, you can backtest it to check what the best strategies are Settings Initial Batch Value Dynamic Investment = If activated it will use an automatic lot according to its capital Balance ($) w/ backtest = Starting balance to backtest PorcRiscoInvestment = It will be the value of % for the automatic lot if it is activated Expiration (in minutes) = It will be the expiration time of orders in Binary Options Ma

Expert system Comets goes through the whole history and all currency pairs with one single setting. The more delay your broker has in the amount of the Internet channel, the higher you need to set stop loss, take profit, and trailing stop so that the server can process them at the required price and the lower the trading frequency will be.
Expert Advisor - works using sharp tick movements. The uniqueness of the Expert Advisor is that it can be run on any hourly period, on any currency pair an
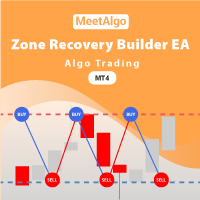
CAP Zone Recovery Strategy Builder EA MT4 is a another version of our Main Product CAP Zone Recovery EA. This EA is a strategy builder type EA has more then 34+ build in indicator that you can make more then 1 million combination strategy that boost you trading strategy. Also this Builder offers an incredible amount of functionality with zone recovery strategy. So you can test your strategy easy way without knowledge of coding. [ Installation Guide | Update Guide | Submit Your Problem

Live results: - Click Here .
- Click Here .
Manual File: you can find it Here in Telegram Group .
What's new ... Click Here . Set files ... Click Here .
By using Dolphin Expert you open a lot of new possibilities to your trading. It has a lot of customization and flexibility that no other expert in the markets offers!
You can choose the strategy based on rules or sequence of rules you define than assign this rules to enter 1st order or/and enter cooling orders or/and enter boostin
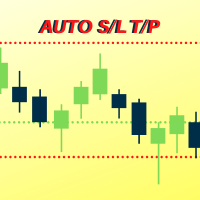
Number one rule to investing is to protect your capital. Never worry about trading without stop loss or take profit with Auto S/L T/P. Auto S/L T/P will automatically add your preset default stop loss and take profit to any order on the chart it's installed. Be sure to enable auto trading in order for the EA to work.
Entering a trade on the go from your mobile is breeze with Auto S/L T/P running on the chart on your desktop. Just enter a trade and your default stop loss and take profit will be
FREE
MetaTrader市场是您可以下载免费模拟自动交易,用历史数据进行测试和优化的唯一商店。
阅读应用程序的概述和其他客户的评论,直接下载程序到您的程序端并且在购买之前测试一个自动交易。只有在MetaTrader市场可以完全免费测试应用程序。
您错过了交易机会:
- 免费交易应用程序
- 8,000+信号可供复制
- 探索金融市场的经济新闻
注册
登录