Milky Way MT5
- Indicadores
- Versión: 4.6
- Actualizado: 18 noviembre 2021
- Activaciones: 5

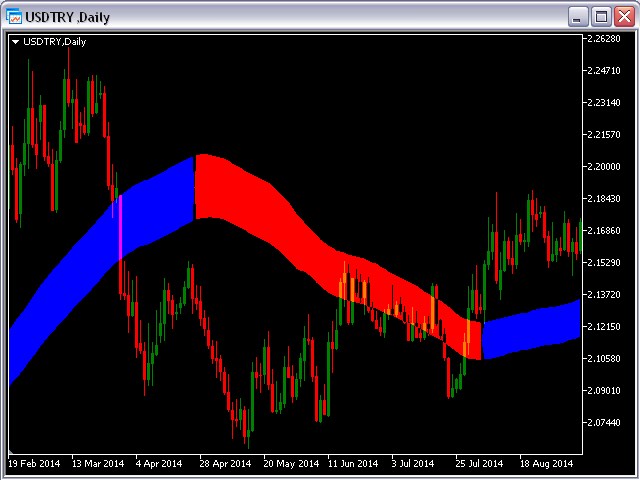
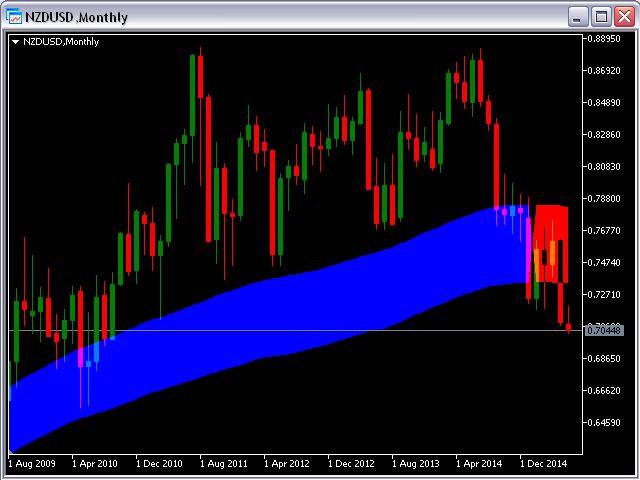
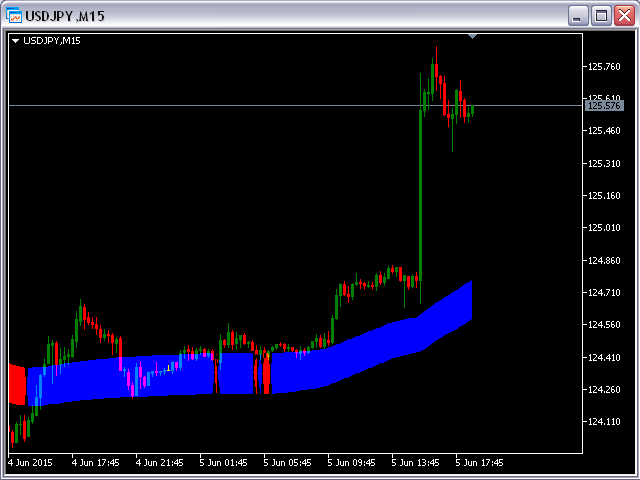
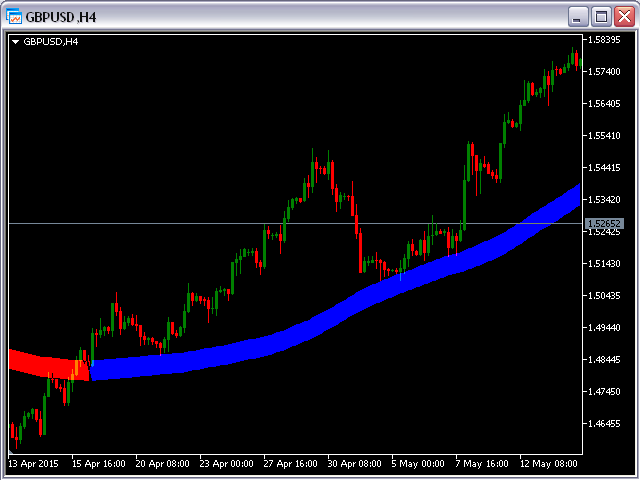
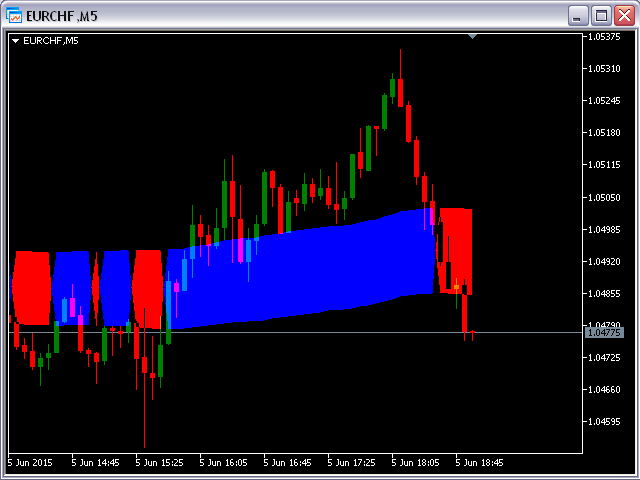
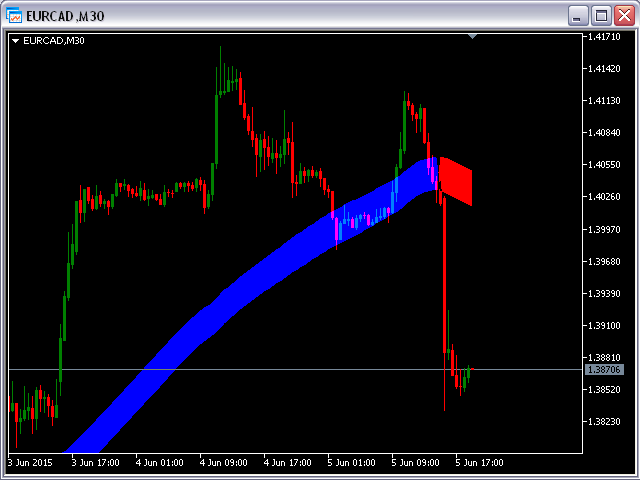
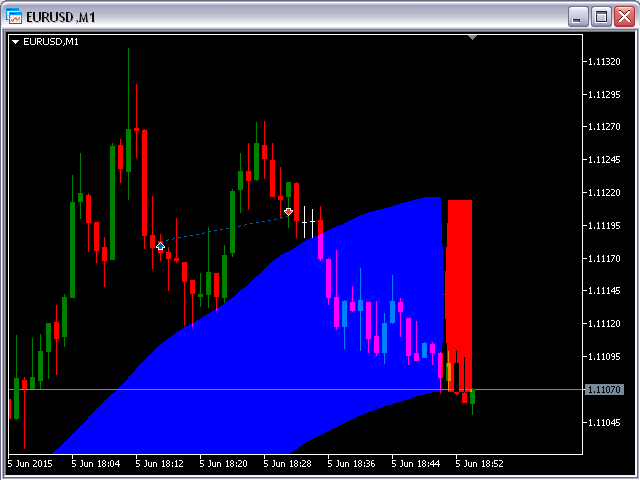
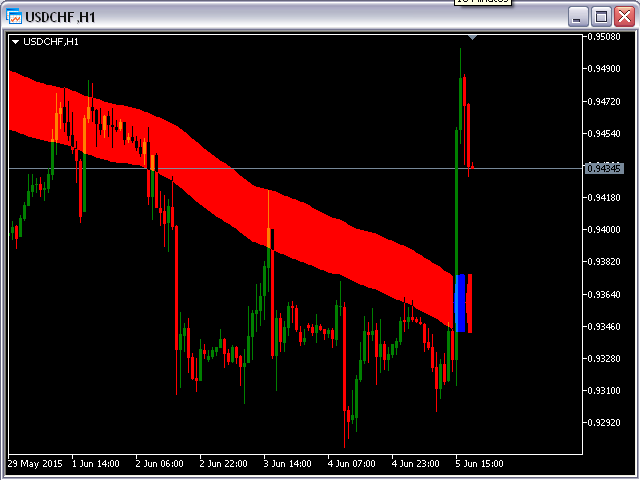
El indicador MilkyWay calcula y dibuja una cinta azul o roja como tendencia y como filtro.
En caso de que el precio se mueva dentro de la cinta, no debe entrar en el mercado.
En caso de que vea una tendencia azul y el precio actual está por encima de la cinta azul que este es un buen momento para ir en largo.
En caso de que vea una tendencia roja y el precio actual esté por debajo de la cinta roja, es un buen momento para ir en corto.
Sólo 1 parámetro de entrada: nBars = 500; - número de Barras donde aparecerá la cinta.