DrawHurdle MT5
- Indicadores
-
Kazuya Yamaoka
 Forex Trader & Forex Live Streamer💹I am publishing all trading steps📹Mainly, US Dollar straight🇺🇸🇪🇺🇯🇵🇬🇧🇨🇳🇦🇺🇨🇦🇨🇭🇭🇰I monetize with 9 MetaTrader original indicators based on established tactics📈I am publishing my daily income on social medias📊
 - Versión: 1.1
- Actualizado: 25 junio 2023
- Activaciones: 5
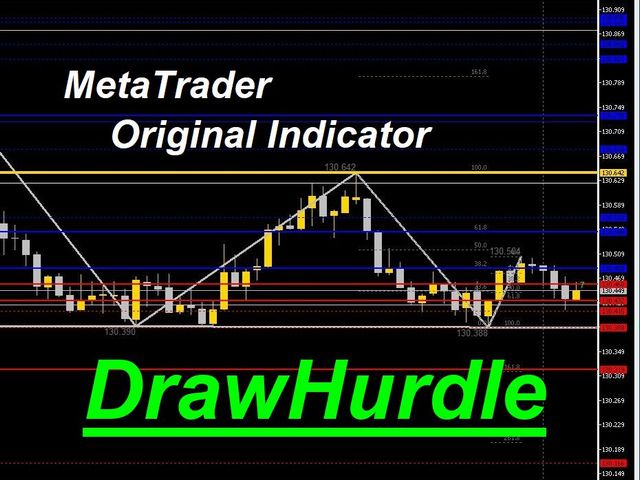
El sistema traza automáticamente líneas de resistencia y de soporte,
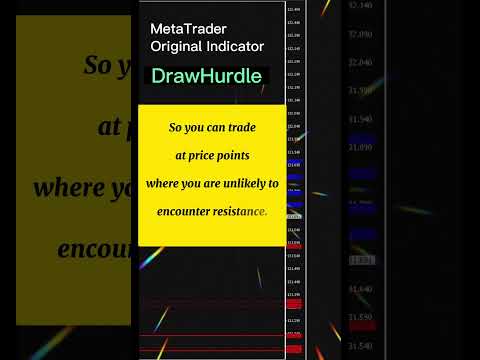
El sistema traza automáticamente líneas de resistencia y de soporte, para que pueda ver de un vistazo el rango de precios en el que es más probable que encuentre resistencia.
Por lo tanto, puede operar en zonas de precios donde es menos probable que encuentre resistencia.
Estamos retransmitiendo en directo el funcionamiento real del sistema.
Por favor, compruebe usted mismo si es utilizable.
Por favor, compruébelo usted mismo.
https://www.youtube.com/@ganesha_forex
No garantizamos los resultados de su inversión. Las inversiones deben hacerse bajo su propio riesgo.
No nos hacemos responsables de cualquier desventaja o daño causado por el uso de la información proporcionada.