DrawHurdle MT5
- インディケータ
-
Kazuya Yamaoka
 FXトレーダー&FXライバー💹具体的な手順まで全てを配信📹ドル円中心🇺🇸🇯🇵定石に基づく9つのMetaTraderオリジナルインジケーターで収益化📈日々の収支も公開📊
 - バージョン: 1.1
- アップデート済み: 25 6月 2023
- アクティベーション: 5
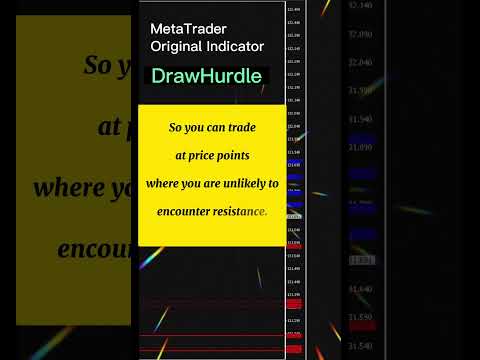
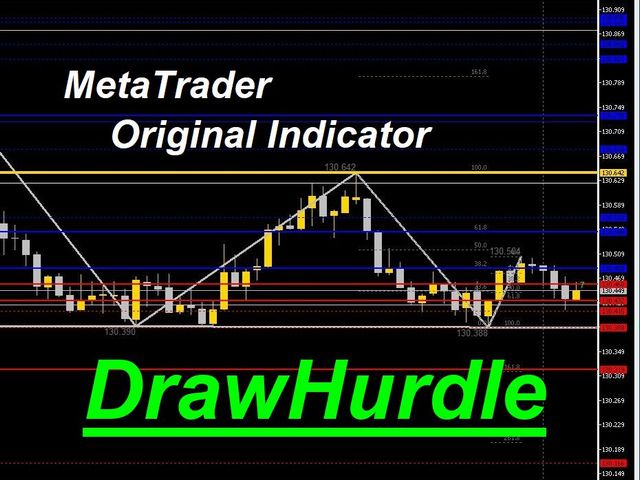
The system automatically draws resistance and support lines,
The system automatically draws resistance and support lines, so you can see at a glance the price range where you are most likely to encounter resistance.
Therefore, you can trade in price zones where you are less likely to encounter resistance.
We are live-streaming the actual operation of the system.
Please check for yourself if it is usable.
Please check it out for yourself.
https://www.youtube.com/@ganesha_forex
We do not guarantee your investment results. Investments should be made at your own risk.
We sharll not be liable for any disadvantage or damage caused by the use of the information provided.