Accumulated Aggression
- Indicadores
-
Edson Cavalca Junior
 Systems developer for over 30 years. Currently developing financial products for the Metatrader platform.
Site:
https://tinosangue.com.br
Youtube: Aprender a Investir - Versión: 1.20
- Actualizado: 18 mayo 2021
- Activaciones: 10
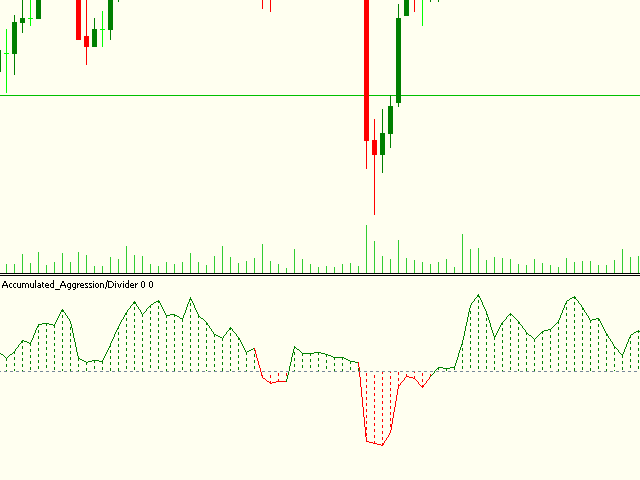
El indicador mide el saldo acumulado de agresiones.
La fórmula es la siguiente:
Accumulated = Previous Candle Accumulated + Purchase Volume - Sales Volume.
*** ¿Te ha gustado el producto? Entonces, ayúdanos haciendo reseñas en la pestaña"Reseñas".
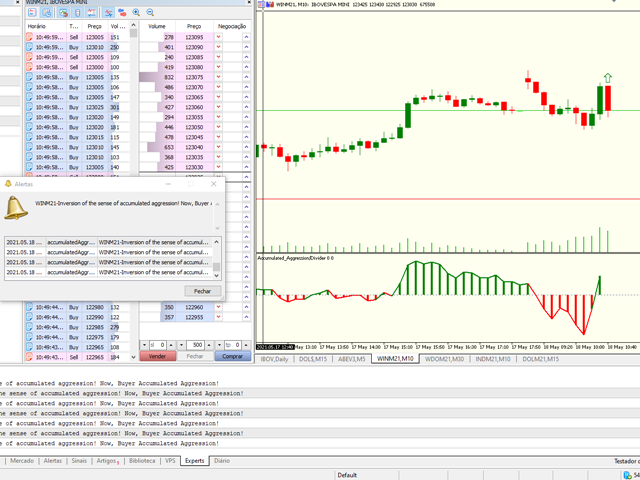
El indicador envía información a su correo electrónico o teléfono móvil cuando el saldo acumulado cambia de dirección.
Ejemplo: Vendedor acumulado se convierte en comprador.
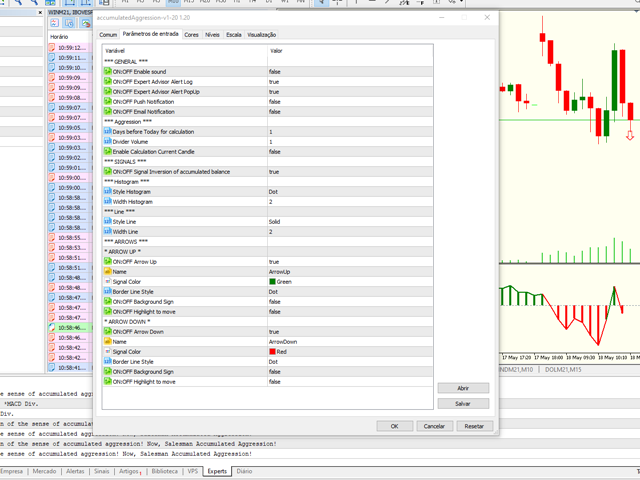
Nota:
- Se recomienda utilizar la configuración por defecto y los valores de VPS.
- Necesita información comercial (Tiempo y Ventas).
Algunos Parámetros:
- Números de días anteriores al actual para el cálculo;
- Divisor de Volumen e;
- Permite el cálculo de la vela actual;
Señal
- Habilita la señal de inversión de la agresión acumulada.
Histograma
- Estilo de línea y;
- Tamaño;
- Estilo de línea y;
- Tamaño;
Síganos en nuestra web para consultar las próximas novedades.
Edson Cavalca Junior
Analista de sistemas