DrawChartPattern MT5
- Indicadores
-
Kazuya Yamaoka
 Forex Trader & Forex Live Streamer💹I am publishing all trading steps📹Mainly, US Dollar straight🇺🇸🇪🇺🇯🇵🇬🇧🇨🇳🇦🇺🇨🇦🇨🇭🇭🇰I monetize with 9 MetaTrader original indicators based on established tactics📈I am publishing my daily income on social medias📊
 - Versión: 1.1
- Actualizado: 25 junio 2023
- Activaciones: 5
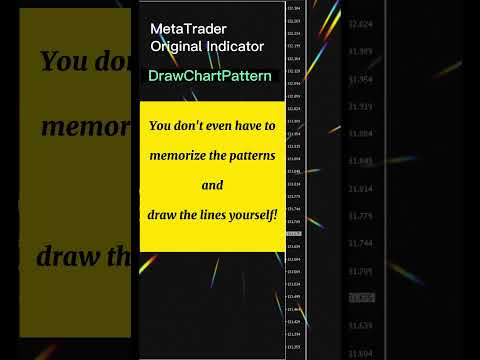
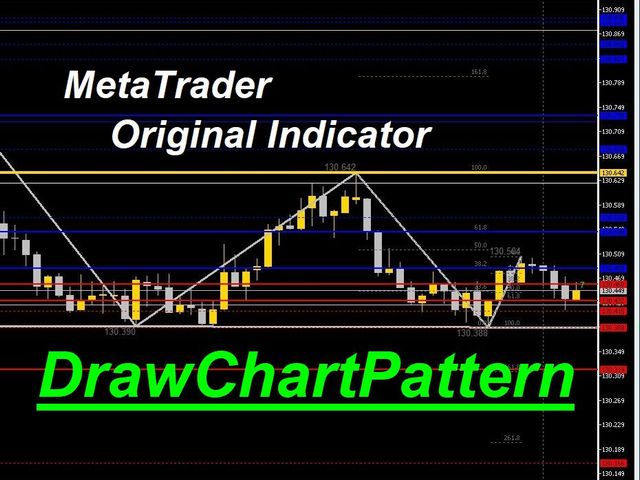
El patrón gráfico se dibuja automáticamente.
También le indica automáticamente el precio al que es más probable que compre o venda según el patrón.
Por lo tanto, no hay necesidad de memorizar patrones o dibujar líneas por sí mismo.
* El "WhaleFinder" incluye cuatro indicadores ("DrawTurningPoint", "DrawHurdle", "DrawChartPattern", "DrawFibonacci").
Por lo tanto, tenga cuidado de no comprar más de una copia (duplicados).
Estamos retransmitiendo en directo el funcionamiento real del sistema.
Por favor, compruebe usted mismo si es utilizable.
Compruébelo usted mismo.
https://www.youtube.com/@ganesha_forex
No garantizamos los resultados de su inversión. Las inversiones deben hacerse bajo su propio riesgo.
No nos hacemos responsables de cualquier desventaja o daño causado por el uso de la información proporcionada.