DrawChartPattern MT4
- Indicadores
-
Kazuya Yamaoka
 Forex Trader & Forex Live Streamer💹I am publishing all trading steps📹Mainly, US Dollar straight🇺🇸🇪🇺🇯🇵🇬🇧🇨🇳🇦🇺🇨🇦🇨🇭🇭🇰I monetize with 9 MetaTrader original indicators based on established tactics📈I am publishing my daily income on social medias📊
 - Versión: 1.1
- Actualizado: 25 junio 2023
- Activaciones: 5
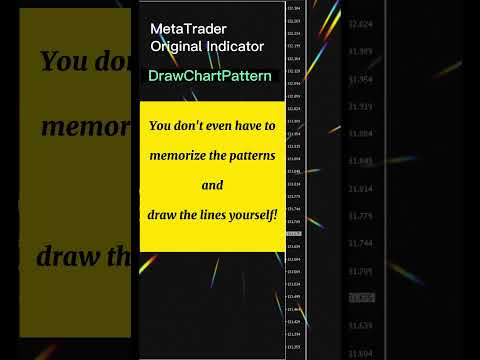
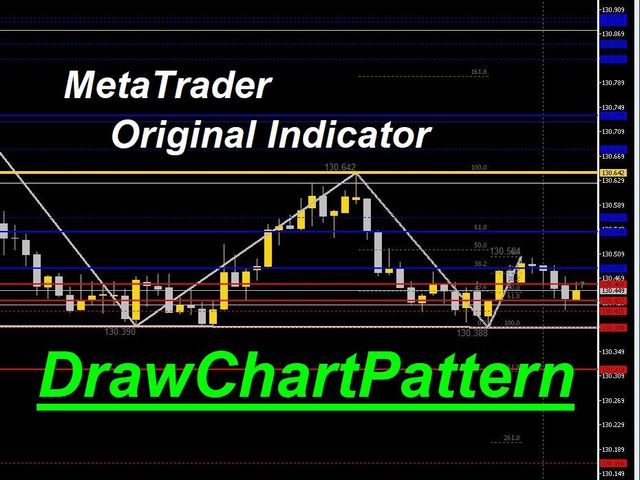
El patrón gráfico se dibuja automáticamente.
También le indica automáticamente el precio al que es más probable que compre o venda según el patrón.
Por lo tanto, no hay necesidad de memorizar patrones o dibujar líneas por sí mismo.
Estamos retransmitiendo en directo el funcionamiento real del sistema.
Por favor, compruebe usted mismo si es utilizable.
Compruébalo tú mismo.
https://www.youtube.com/@ganesha_forex
No garantizamos los resultados de su inversión. Las inversiones deben hacerse bajo su propio riesgo.
No nos hacemos responsables de cualquier desventaja o daño causado por el uso de la información proporcionada.