CountDown MT5
- Indicadores
-
Kazuya Yamaoka
 Forex Trader & Forex Live Streamer💹I am publishing all trading steps📹Mainly, US Dollar straight🇺🇸🇪🇺🇯🇵🇬🇧🇨🇳🇦🇺🇨🇦🇨🇭🇭🇰I monetize with 9 MetaTrader original indicators based on established tactics📈I am publishing my daily income on social medias📊
 - Versión: 1.1
- Actualizado: 25 junio 2023
- Activaciones: 5
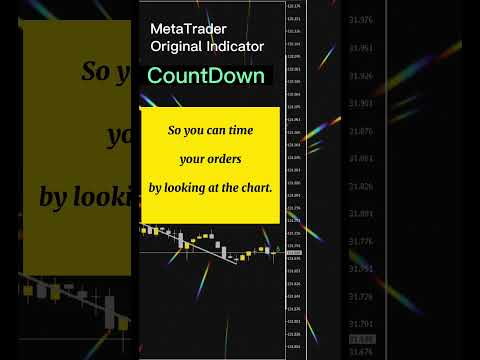
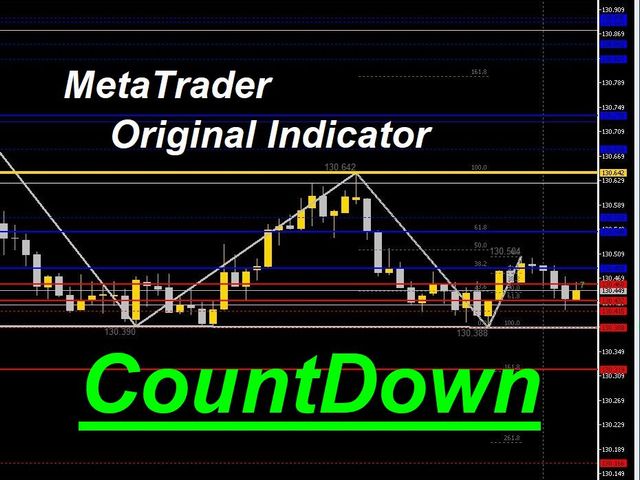
El tiempo hasta el final de la barra se cuenta hacia atrás.
Por lo tanto, puede cronometrar su orden mientras observa el gráfico.
Puede concentrarse en sus operaciones.
Estamos retransmitiendo en directo el funcionamiento real del sistema.
Por favor, compruebe usted mismo si es utilizable.
Compruébelo usted mismo.
https://www.youtube.com/@ganesha_forex
No garantizamos los resultados de su inversión. Las inversiones deben hacerse bajo su propio riesgo.
No nos hacemos responsables de cualquier desventaja o daño causado por el uso de la información proporcionada.