HiLo Trend Matrix MT5
- Indicadores
-
Andrew Ingosi Likare
 A software engineer and a passionate forex trader.
https://icmarkets.com/trading-accounts/overview/?camp=31607 - Versión: 1.0
- Activaciones: 20
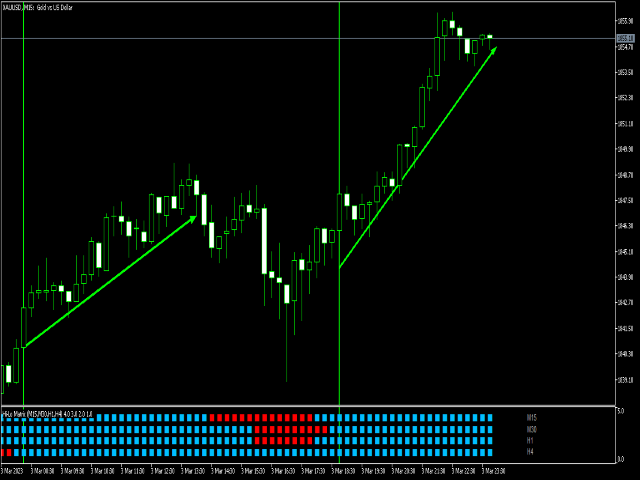
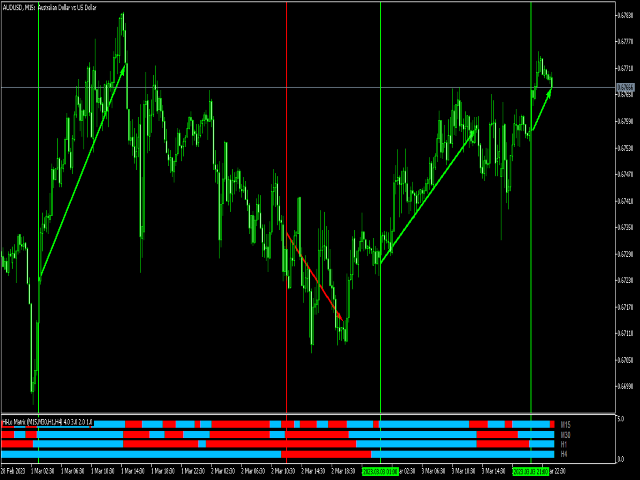
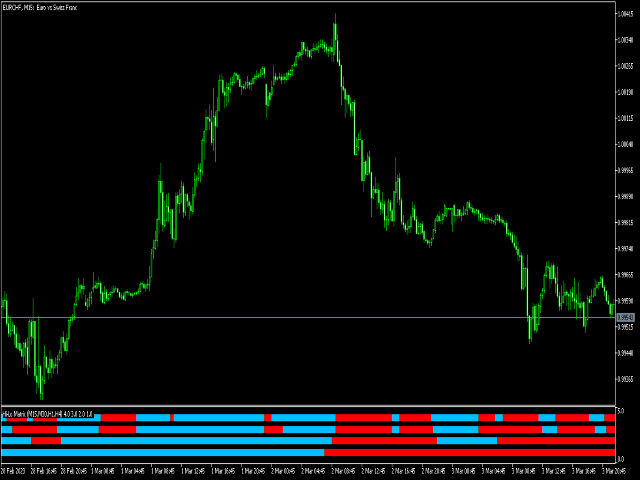
HiLo Trend Matrix es un avanzado indicador de tendencia multi-marco temporal que escanea y analiza múltiples marcos temporales para determinar la dirección general de la tendencia, lo que le permite montar sin esfuerzo las ondas de tendencia a medida que surgen.
Al escanear los cuatro plazos superiores, empezando por su plazo actual o uno seleccionado a partir de los parámetros de entrada, siempre tendrá una visión completa de los movimientos del mercado. Y cuando la tendencia se alinea, la HiLo Trend Matrix emite una alerta, para que pueda aprovechar la oportunidad de maximizar los movimientos del mercado.
Tanto si es un scalper como un swing trader, la HiLo Trend Matrix es la solución perfecta para mantenerse a la vanguardia.
Lo más destacado:
- Escanea 4 marcos temporales a la vez
- Alertas sonoras
- Alertas por email
- Notificaciones Push