SV Divergence All with confirm
- Indicadores
-
Minh Truong Pham
 Hello, my name is Pham and I am a programmer and trader! At here, I create amazing forex indicators and expert advisors for Metatrader.
I will try:
+ Provide best tools base on my 5 years experience as a trader and 10 years as a programmer. - Versión: 1.2
- Actualizado: 9 marzo 2023
- Activaciones: 5
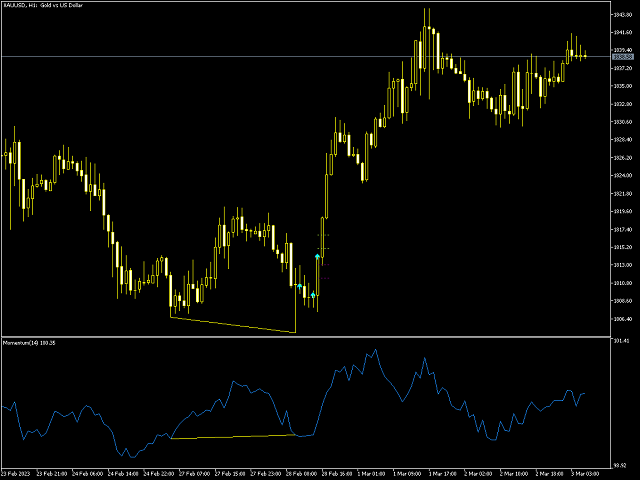
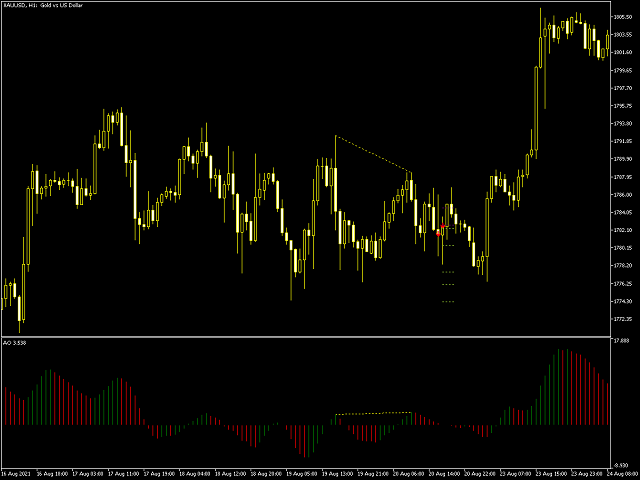
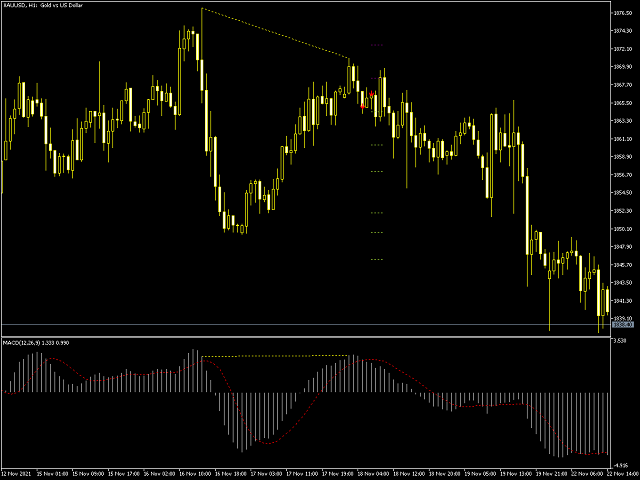
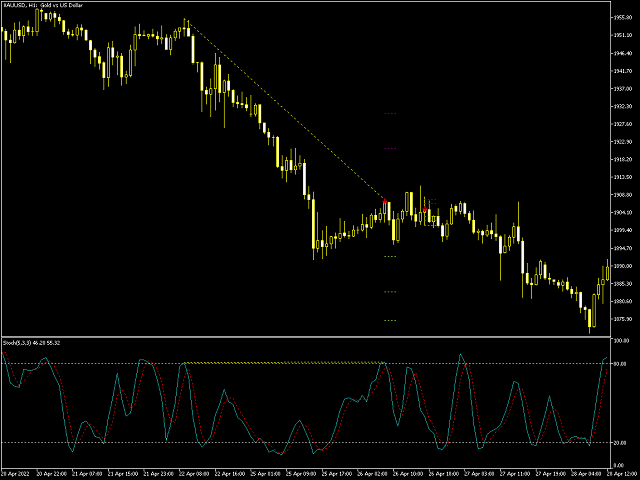
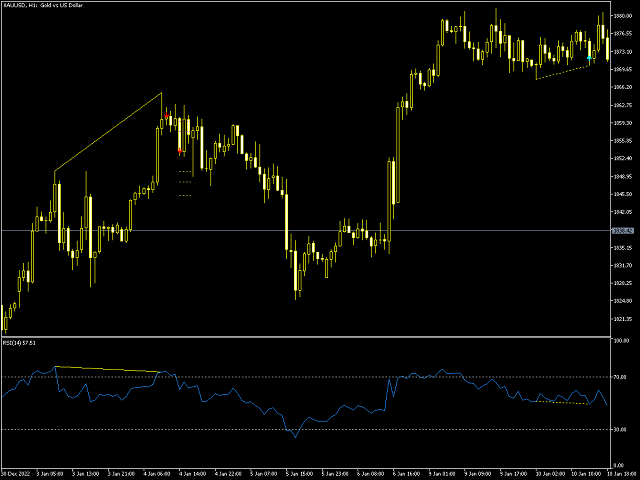
Detectar la divergencia (clásico, oculto) de precios y todos los indicadores osciladores incluyen: RSI, CCI, MACD, OSMA, Estocástico, Momentum, Awesome Oscillator (AO), Accelerator Oscillator (AC), Williams Percent Range (WPR), Relative Vigor Index (RVI), Rate of Change (ROC). Confirme la reversión con el canal dochian para mejorar la calidad de la señal.
La divergencia se produce cuando el precio de un activo se mueve en dirección opuesta a un indicador técnico, como un oscilador, o se mueve en dirección contraria a otros datos. La divergencia advierte de que la tendencia actual del precio puede estar debilitándose y, en algunos casos, puede llevar a que el precio cambie de dirección. Existen algunas reglas a la hora de determinar la divergencia:
+ El precio debe tener un punto extremo en los puntos definidos de divergencia. El punto extremo puede ser HH, LL para la divergencia clásica y LH, LH para la divergencia oculta.
+ La pendiente del precio y el oscilador deben ser de dirección opuesta.
Este indicador escanea divergencia y convergencia en ambas etapas, oculta y clásica del precio y oscilador común. Usted puede elegir uno de los osciladores de la configuración del indicador. Cuando ocurra una divergencia, el indicador alertará al usuario. En el rango de 10 velas después de la divergencia, si el precio se confirma por el canal Dochian, el indicador activará la señal de compra o venta y notificará al usuario. De esta manera, la señal de compra o venta es más precisa.
Algunas ventajas:
- Fácil de operar
- Encuentra divergencias regulares y ocultas
- Soporta muchos osciladores bien conocidos
- Implementa señales de trading basadas en rupturas
- Muestra niveles adecuados de stop-loss y take-profit
- Parámetros de oscilador configurables
- Colores y tamaños personalizables
- Gama de filtros, desde divergencias hasta confirmación de reversión de precios
- Implementa notificaciones de muchas maneras: MT5 terminator, MT5 mobile app, Alerta, Telegram
Para ofrecer una amplia perspectiva del mercado, el indicador se puede cargar muchas veces en el mismo gráfico utilizando diferentes osciladores, sin interferencias. El indicador soporta los siguientes osciladores
- RSI
- CCI
- MACD
- OSMA
- Estocástico
- Momentum
- Oscilador impresionante
- Oscilador Acelerador
- Rango Porcentual Williams
- Índice de Vigor Relativo
- Tasa de Cambio
Nota:
Este indicador no se repinta en absoluto. La señal de divergencia se dibujará la primera vez que ocurra. Si el precio cambia en la misma vela o en la siguiente, hará que el punto de divergencia cambie o desaparezca, pero el indicador no volverá a pintar la señal (se activará la primera vez).
El usuario puede cargar varios indicadores en el mismo gráfico. Cada uno de ellos se encarga de un tipo de oscilador.
Parámetros de entrada
- Amplitud: Periodo Zig-Zag usado para encontrar divergencias
- Oscilador - Elija el oscilador para cargar en el gráfico.
- Periodo de ruptura - Periodo de ruptura en barras para las señales de negociación.
- Tipos de divergencia - Activar o desactivar los tipos de divergencia: oculta, regular o ambas.
- Máximo de barras de una divergencia para confirmar.
- Configuración del indicador - Configuración deseada del indicador para todos los osciladores involucrados.
- Periodo RSI
- Período CCI
- Período WPR
- Período Momentum
- Períodos estocásticos
- Periodo MACD
- Periodo RVI
- Periodo ROC
- Ajustes de dibujo - Elija los colores y el tamaño de las líneas de las divergencias.
- Alertas - Habilite o deshabilite las alertas de muchas maneras.