Impuls Fibo
- Indicadores
- Versión: 1.0
- Activaciones: 5

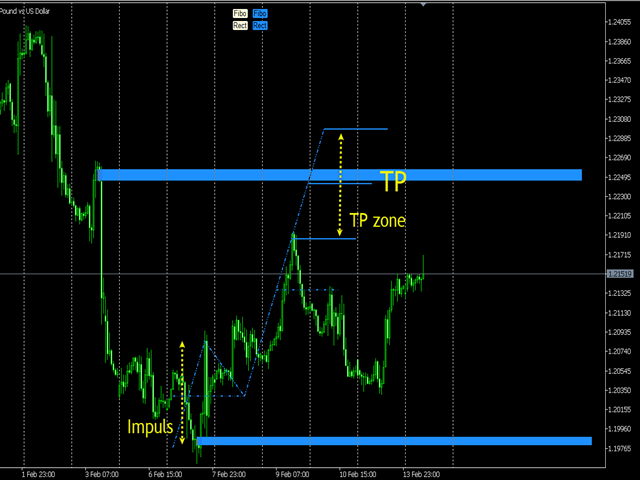
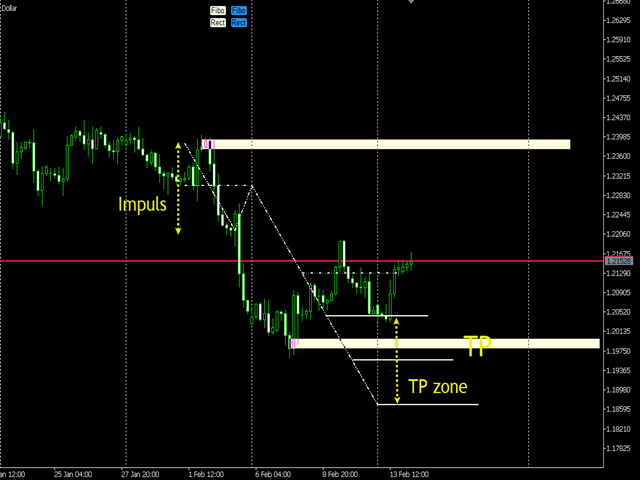
El indicador Impulse Fibo se utiliza para determinar los niveles de precios después de que se produzca algún impulso de precios. Cómo usarlo se puede ver en las capturas de pantalla y vídeo. En la configuración del indicador puede fijar dos configuraciones diferentes para dos patrones diferentes. Para la comodidad de dibujo también dos rectángulos diferentes puede ser fácil de poner en la pantalla para dibujar los niveles de soporte / resistencia.
.
Entradas
- Dibujar patrón 1
- Color de línea - elija el color en el menú desplegable
- Estilo de línea - elija el estilo en el menú desplegable
- Ancho de línea - introduzca un número entero 1,2,3...
- Dibujar patrón 2
- Color de línea - elija el color en el menú desplegable
- Estilo de línea - elija el estilo en el menú desplegable
- Ancho de línea - introduzca el número entero 1,2,3...
Por lo tanto, buena suerte en el comercio:)