SR levels true
- Indicadores
- Versión: 1.0
- Activaciones: 5

El indicador SR levels true en pequeños marcos de tiempo es muy útil para scalping, mientras que en los más grandes es bueno para el día o el comercio de posición.
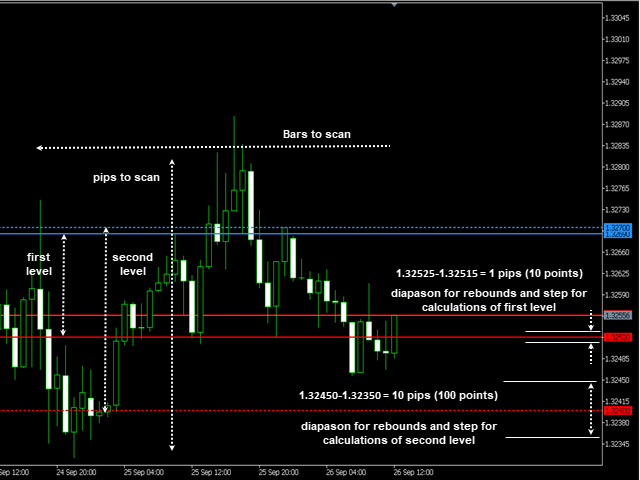
SR levels true puede dibujar 4 niveles de soporte/resistencia basados en rebouds máximos definidos desde el nivel de precios. El indicador escanea un número definido de barras en el eje de tiempo y un número definido de pips en el eje de precio (ambos lados - arriba y abajo) y calcula cuántas veces el precio fue rechazado de los niveles de precio escaneados. En los niveles de precios donde se cuentan los rebotes máximos, se trazan los niveles de soporte o resistencia correspondientes.
Es importante mencionar que para el primer nivel el diapasón (o ancho) del nivel de precios a rechazar es de 1 pip por defecto y para el segundo nivel es de 10 pips. Si el valor del pip de la equidad es muy pequeño (por ejemplo bitcoin) es sensato incrementar el valor del poder del pip de 1 por defecto a 2 o más. Si el valor del poder del pip es 2, significa que para el primer nivel el diapasón del precio a rechazar es de 10 pips y para el segundo - 100 pips. Para mayor claridad puede ver la primera captura de pantalla.
También tenga en cuenta que si establece por ejemplo 50 pips para escanear significa que para el primer nivel el indicador escanea 50 pips en ambas direcciones con un paso igual a 1 pip y para el segundo nivel escanea 500 pips con un paso igual a 10 pips.
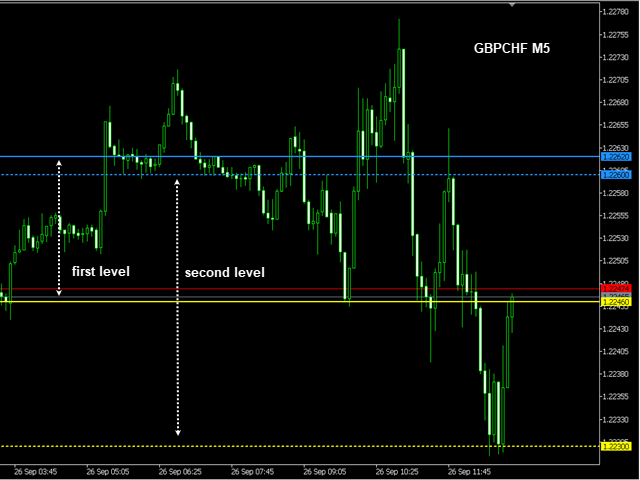
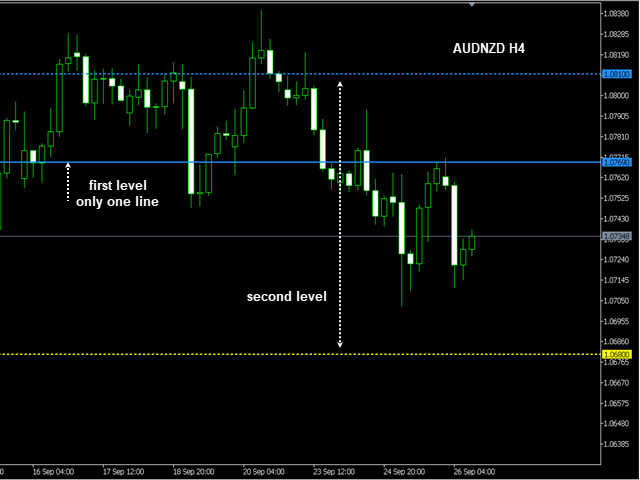
Algunas veces las líneas del segundo nivel pueden ocurrir entre las líneas del primer nivel o si no hay suficiente número de rebotes el nivel no es dibujado en absoluto.
Parámetros de entrada:
Parámetros principales
- Barras a escanear - elija el número de barras a escanear
- Pips a escanear - elija el número de pips a escanear para una dirección.
- Rebotes min - ingrese el número mínimo de rebotes para dibujar la línea.
- Pip power - grado decimal. 1 significa 1 pip (10 puntos), 2 significa 10 pip (100 puntos) y así sucesivamente.
Configuración de las líneas
- Color del nivel - seleccione el color en el menú desplegable
- Ancho del nivel - introduzca un número entero
- Estilo del nivel - seleccione el estilo en el menú desplegable