FZR Fractal Zigzag Reversal mql5
- Indicadores
- Versión: 1.0
- Activaciones: 5

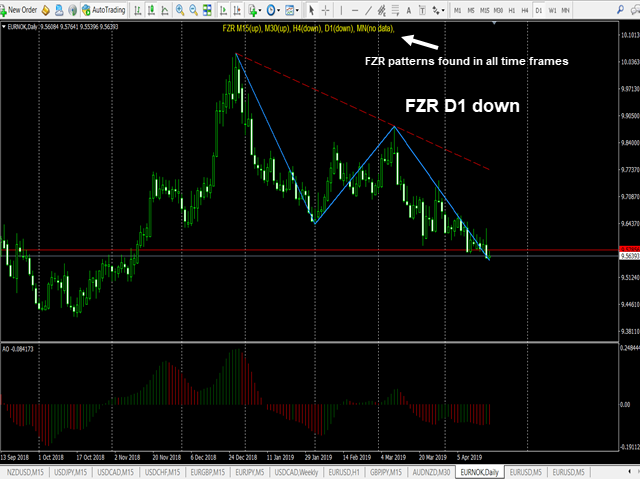
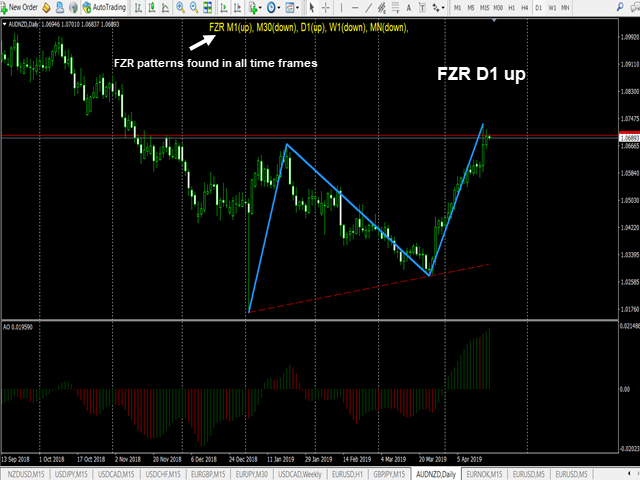
El indicador FZR determina el patrón de inversión en zigzag fractal de todos los marcos temporales del símbolo elegido y muestra la información en la etiqueta Info. El indicador dibuja el patrón detectado en el marco de tiempo elegido y también se puede seleccionar en el menú para dibujar la línea de tendencia de acuerdo a los picos FZR.
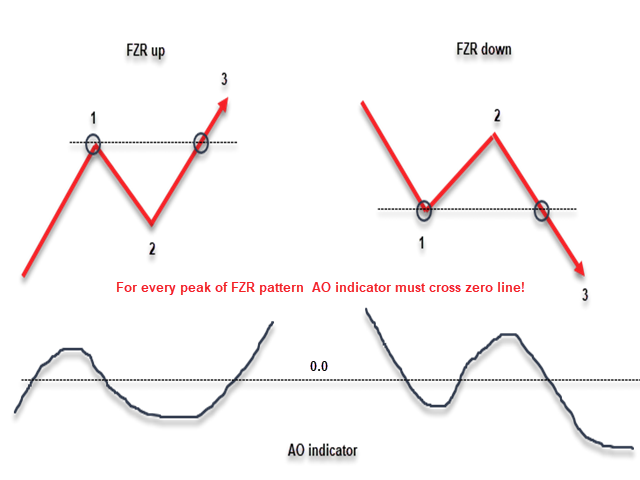
¿Qué es FZR? Vea la primera imagen en las capturas de pantalla. Como puede ver para cada pico de FZR el indicador AO debe cruzar la línea cero. El indicador FZR determina la dirección de la tendencia.
¿Cómo usar FZR para operar? Cuando se detecta el patern FZR y se dibuja la línea de tendencia, puede esperar a que el precio se acerque a la línea de tendencia y comprar o vender en la dirección FZR. El primer nivel de toma de beneficios es el último pico del FZR y los otros pueden ser recuperados por los niveles de Fibonacci. Por supuesto, usted debe evaluar el espacio disponible para que el precio se vaya.
Puede elegir diferentes propiedades de visualización de la etiqueta Info y FZR o líneas de tendencia.
Parámetros:
--------------Info label---------------
- Color de la etiqueta
- Tamaño de letra de la etiqueta de información
- Posición de la etiqueta de información Arriba o Abajo en el centro del gráfico
---------------FZR line---------------
- Color de la línea FZR
- Ancho de línea FZR
- Estilo de línea FZR
--------------Trend line---------------
- Sí o No para mostrar la línea de tendencia
- Color de la línea de tendencia
- Anchura de la línea de tendencia
- Estilo de la línea de tendencia
Very useful indicator.