Abiroid BB Squeeze Scanner
- Indicadores
-
Abir Pathak
 I create MT4 and MT5 indicators. They are mainly arrows and scanner indicators and also some essential utilities.
I'm hoping they will make your trading easier and make you profitable.
You can join my Telegram channel to keep track of all products I post. - Versión: 1.4
- Actualizado: 27 junio 2025
- Activaciones: 20
Acerca del escáner:
La entrada detallada del blog está aquí:
https://www.mql5.com/en/blogs/post/749119
BB Squeeze Scanner utiliza bbsqueeze .ex4 en segundo plano para calcular cuando BB Squeeze (Bollinger Bands Squeeze) ocurre y cuando las BBands se expanden.
Se adjunta con la entrada del blog anterior.
Qué es el Bollinger Bands Squeeze:
La compresión de las bandas de Bollinger es un patrón especial cuando la volatilidad de un mercado disminuye después de períodos de tendencia.
Generalmente se observa que el precio oscila durante este periodo hasta que se inicia una nueva tendencia y la volatilidad aumenta de nuevo.
Para identificar este patrón, utilizamos los canales de Keltner.
Y buscamos el momento en el que las bandas de Bollinger se encuentran entre los límites superior e inferior de los canales de Keltner.
Ajustes:
Puedes leer sobre todos los ajustes comunes de Abiroid Scanner en esta entrada del blog:
https://www.mql5.com/en/blogs/post/747456
Shift: Barra inicial a escanear
Note: Shift 0 means current bar which is still forming. And while price moves, the BB Squeeze values might change and you might get multiple alerts.
Si quieres que no se repinte, mantén Shift 1.
Max Past bars: Máximo de barras a escanear
Si BB Squeeze rojo o verde ha continuado desde antes de las barras Max Past, entonces el escáner mostrará el valor del paréntesis como (+).
Actualizar Después de Ticks:
El escáner refrescará cada nueva barra, y después de cada número dado de ticks.
Cómo se calcula el Squeeze:
Las configuraciones de Bollinger y Keltner son usadas para calcular las Bandas de Bollinger y los canales de Keltner.
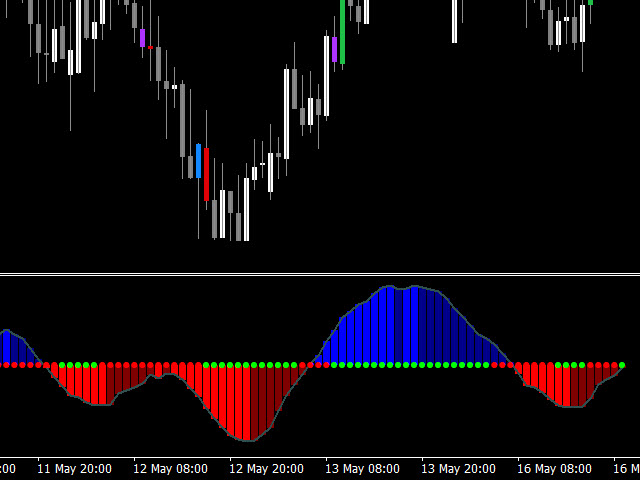
Y si las bandas de Bollinger están dentro de los canales de Keltner, entonces BB Squeeze es rojo. Significa que el precio está oscilando.
Si las bandas de Bollinger están fuera de los canales de Keltner, entonces BB Squeeze es verde. Significa que la volatilidad es alta.
El histograma es azul para cuando el precio está en tendencia alcista. El azul oscuro muestra que la tendencia se está desacelerando y terminará pronto.
Es rojo cuando el precio tiende a la baja y la tendencia bajista es creciente. El color granate indica que la tendencia bajista finalizará pronto.
Mejores Operaciones:
Si estás siguiendo una estrategia basada en la Tendencia, intenta asegurarte de que el marco de tiempo en el que estás operando y los siguientes marcos de tiempo superiores están alineados con el fondo Verde.
Significa que no hay BB Squeeze y la volatilidad es alta. El mejor momento es cuando No squeeze (Verde) acaba de empezar unas barras atrás. Y la tendencia del precio hacia arriba/abajo también acaba de empezar.
Por lo tanto, asegúrese de que la flecha no indica que la tendencia se está desacelerando. Es decir, las flechas no son de color azul oscuro o granate.
Este escáner es una herramienta de validación. Se utiliza mejor con su estrategia basada en la tendencia existente. Para proporcionarle los mejores momentos para operar.
Porque diferentes pares de comercio serán más activos durante diferentes momentos del día.
No es para ser utilizado como una estrategia independiente.


Great Indicator. It really helps with keeping an eye on multiple pairs and multiple timeframes to see the Best setups. Good Job!!!