Ticks Bears
- Indicadores
- Versión: 1.12
- Actualizado: 18 noviembre 2021
- Activaciones: 5

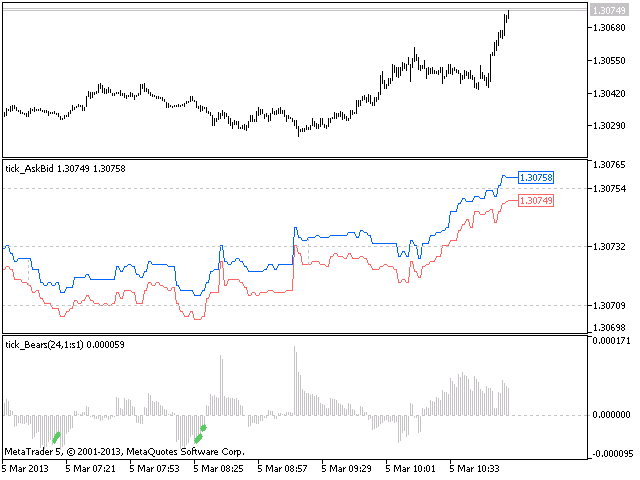
El indicador Bears Power se dibuja utilizando un gráfico de ticks.
Después de lanzarlo, espere a que aparezcan suficientes ticks.
Parámetros:
- Período - período de promediación.
- El número de ticks para identificar alto/bajo - número de ticks individuales para determinar alto/bajo.
- Barra calculada - número de barras para el cálculo del indicador.
Los siguientes parámetros sirven para ajustar el peso de las señales Bears Power (de 0 a 100). Puede encontrar su descripción en la sección Señales del oscilador Bears Power de la Referencia MQL5.
- Inversión del oscilador a la dirección requerida.
- Divergencia del oscilador y el precio.
Índices de amortiguación: 0 - Osos, 3 - VALOR DE SEÑAL