Brilliant Auto Regression Channels
- Indicadores
- Versión: 1.1
- Actualizado: 2 diciembre 2021
- Activaciones: 5

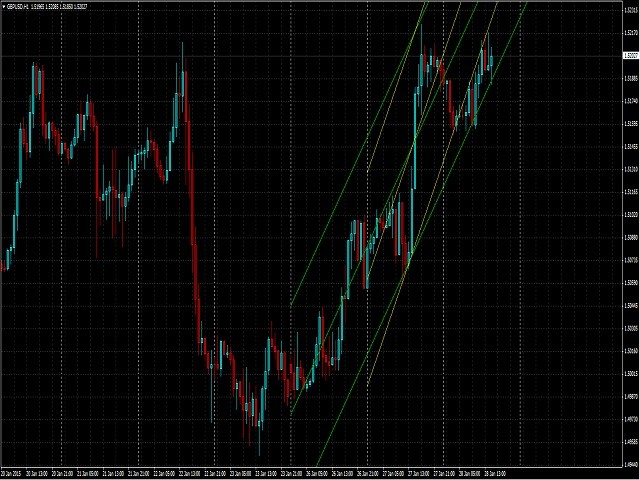
El indicador dibuja automáticamente hasta cinco canales de regresión diferentes.
El producto dibuja los canales de los períodos principales anteriores.
Por ejemplo
| Gráfico del indicador | Período de trazado |
|---|---|
| M1 |
D1 |
| M5 | D1 |
| M15 | D1 |
| M30 | D1 |
| H1 | D1 |
| H4 | W1 |
Se actualiza al principio del periodo principal (ej.: D1 o W1).
Los periodos están en el dominio del periodo mayor.
Por ejemplo: si el indicador se coloca en un gráfico H1, el período de 1 significa 1 día en el gráfico.