Brilliant Price Action
- Indicadores
- Versión: 1.1
- Actualizado: 1 diciembre 2021
- Activaciones: 5

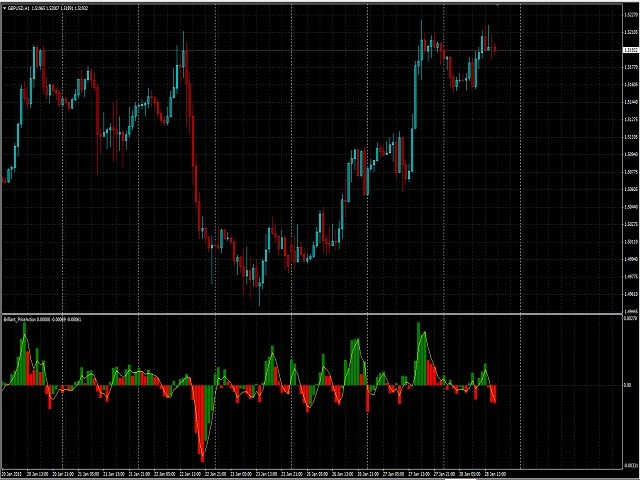
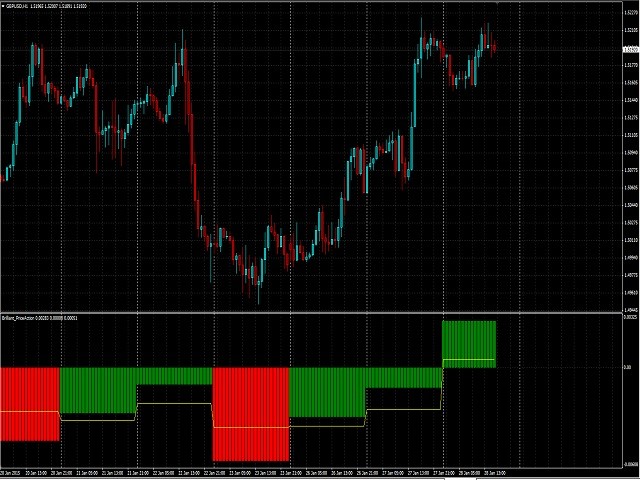
Indicador Brilliant Price Action
Brilliant Price Action Indicator es un indicador líder que no se repinta.
Puede ser calculado en un marco de tiempo y representado en otro marco de tiempo.
Puede ser utilizado en la identificación de la tendencia de los marcos de tiempo más altos O para la entrada en los marcos de tiempo más bajos.
Los modos de media móvil son:
0 = Media móvil simple.
1 = Media móvil exponencial.
2 = Media móvil suavizada.
3 = Media móvil lineal ponderada.