ProfileVolumesMarket
- Indicadores
- Versión: 4.2
- Actualizado: 29 noviembre 2021
- Activaciones: 5

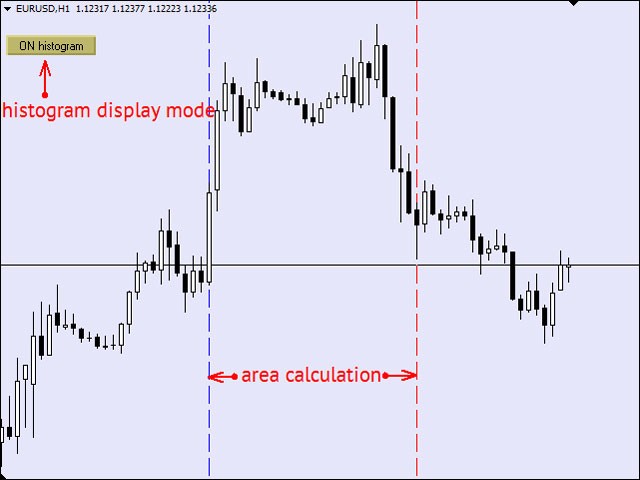
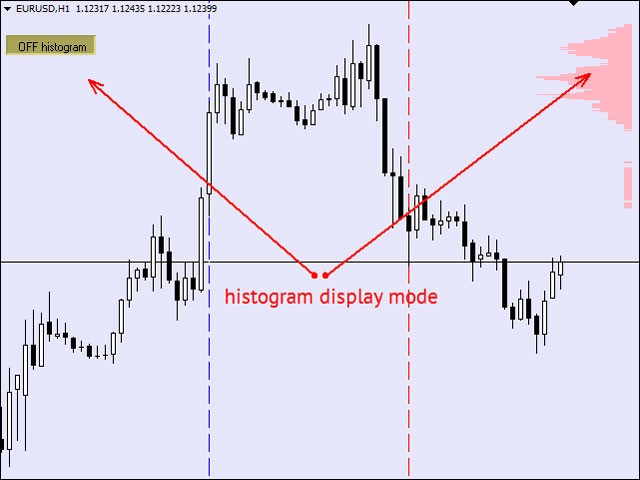
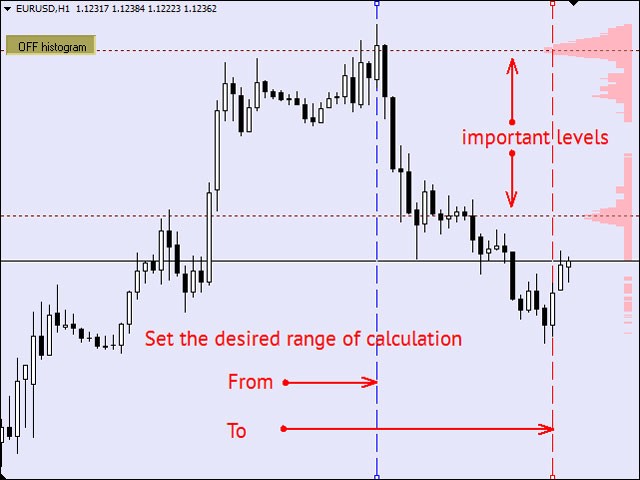
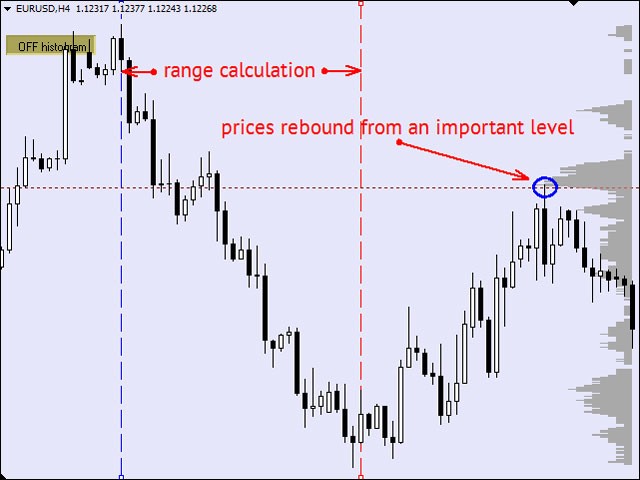
El indicador ProfileVolumesMarket calcula el volumen de ticks en cada nivel de precios de un rango seleccionado. El volumen es vital a la hora de determinar la fuerza y, por tanto, la importancia de los niveles de precios. El rango de cálculo lo establece el operador moviendo dos líneas verticales. De este modo, el indicador permite realizar un seguimiento de los niveles importantes en los distintos pasos de la formación del precio de un símbolo. El histograma del perfil de volumen puede mostrarse en el gráfico (o eliminarse del gráfico) si pulsa el botón "ON" ("OFF"). Al cambiar el período del gráfico, también cambia el rango de cálculo del indicador, lo que resulta ideal para estimar la precisión de los niveles en marcos temporales inferiores. El botón "||" limita el cálculo del indicador a la zona visible del gráfico actual. El color del histograma está determinado por la posición del precio actual en relación con el nivel máximo. Los parámetros shift y ratio permiten personalizar el histograma. Existen dos modos de cálculo del indicador. En el modo ModeTimer, el cálculo del indicador se basa en la señal generada por el temporizador interno del sistema, lo que permite trabajar con él incluso cuando el mercado está cerrado. En el modo ModeTick, el indicador se recalcula cada minuto, lo que permite seguir los cambios actuales en el volumen y comprobar el funcionamiento del indicador en modo de prueba. El indicador comprueba automáticamente si hay "agujeros" en el historial de cotizaciones y selecciona el marco temporal más pequeño con el historial completo como base, mientras que la información correspondiente se muestra en el comentario.
Entradas del indicador
- Set_Mode - seleccionar el modo de cálculo del indicador.
- ColorLevelNon - color del histograma si el precio actual es igual al nivel de volumen máximo.
- ColorLevelBull - color del histograma si el precio actual está por encima del nivel de volumen máximo.
- ColorLevelBear - color del histograma si el precio actual está por debajo del nivel de volumen máximo.
- ColorLineFrom - color de la línea vertical del inicio del rango de cálculo del indicador;
- ColorLineTo - color de la línea vertical del final del rango de cálculo del indicador;
- coeff - coeficiente del ajuste de visualización del histograma.
- ShiftBars - número de barras para desplazar el histograma hacia la izquierda.
- ShowComment - mostrar el comentario si hay "agujeros" en el historial de cotizaciones del marco temporal más pequeño.


Effective and responsive as the market changes. Recommended