Harmonic Patterns Scanner MT5
- Indicadores
-
Reza Aghajanpour
 =============================================================================================
<<<<<< Our team after 19 years of experience in the markets and programming would like to share winner solutions with you. >>>>>> - Versión: 1.11
- Actualizado: 24 enero 2026
- Activaciones: 20
Introducción
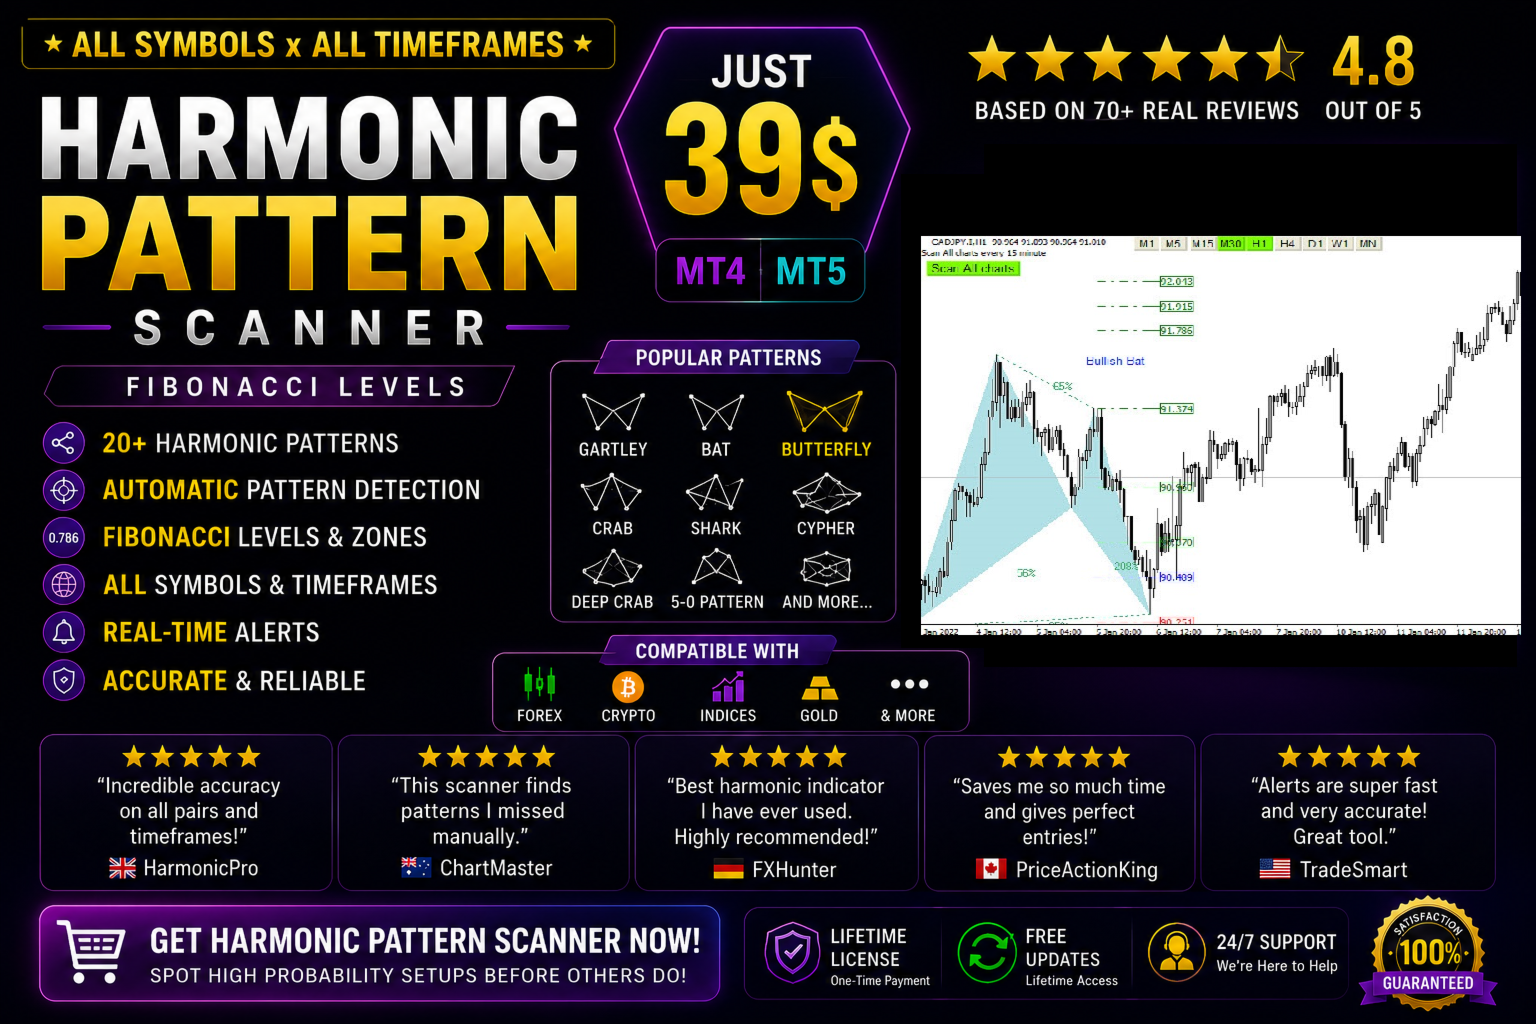
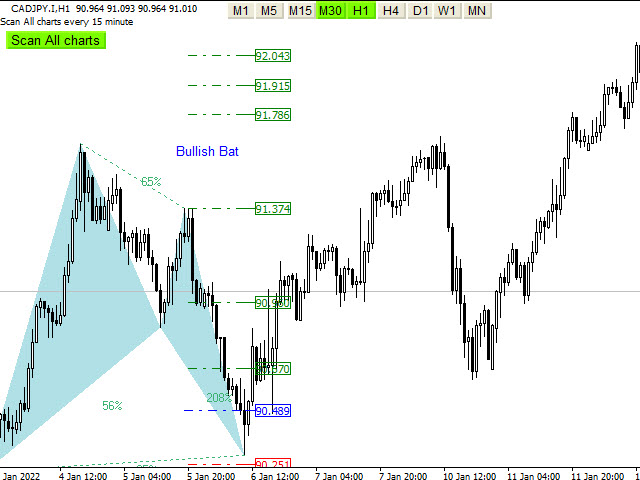
Los patrones armónicos son los más utilizados para predecir el punto de inflexión. Los patrones armónicos le dan una alta tasa de ganancias y altas oportunidades para el comercio en un día. Este indicador detecta los mejores y exitosos patrones basados en los conceptos de Harmonic Trading.
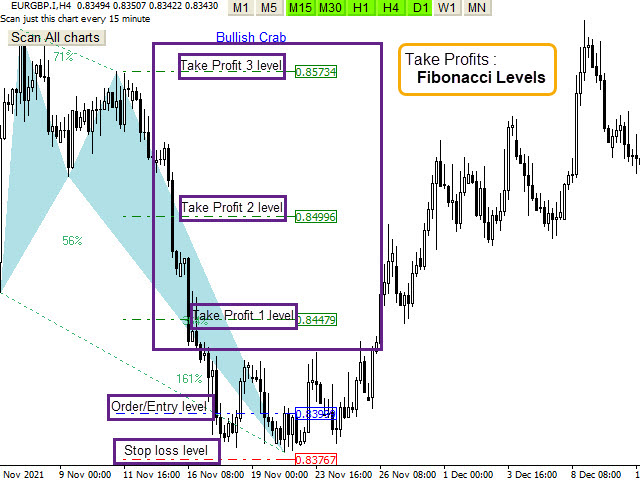
El escáner de patrones armónicos escanea todos los gráficos con sólo pulsar un botón. Tiene stop loss, Take profits y niveles de punto de entrada con eluso de los niveles de Fibonacci y la comprobación de velas para encontrar el mejor punto de entrada y salida de la negociación. Encuentra señales de inmediato con alarma y notificación para el comercio fácil.
Características principales
- Detecta los mejores y patrones de mayor éxito: Gartley, Bat, Crab, Butterfly, Cypher, Shark, Alt Bat, Deep Crab.
- Indicador fácil de usar
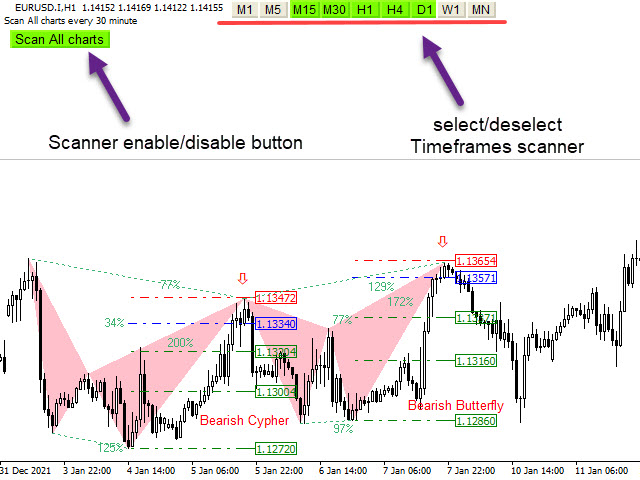
- Botón de escaneo de todos los gráficos ( Forex, Criptodivisas, Índices y materias primas )
- Selecciona y deselecciona marcos de tiempo para escanear (M5,M15,M30,H1,H4,D1,W1,MN)
- Muestra y notifica los niveles de stop-loss, entry-point y take-profit
- Comprobación de velas para el mejor punto de entrada
- Método para elegir el patrón de aparición: ruptura (después de la ruptura) o patrón (en la pierna 4)
- Utiliza los niveles de Fibonacci
- Dibuja la proyección ABCD
- Detección de la Zona de Reversión Potencial (PRZ) para la identificación de la Reversión
- Detección de la Zona de Continuación Potencial (PCZ) para la predicción del movimiento del precio
- Detección de Intervalo de Finalización de Patrón (PCI) para más oportunidades de trading
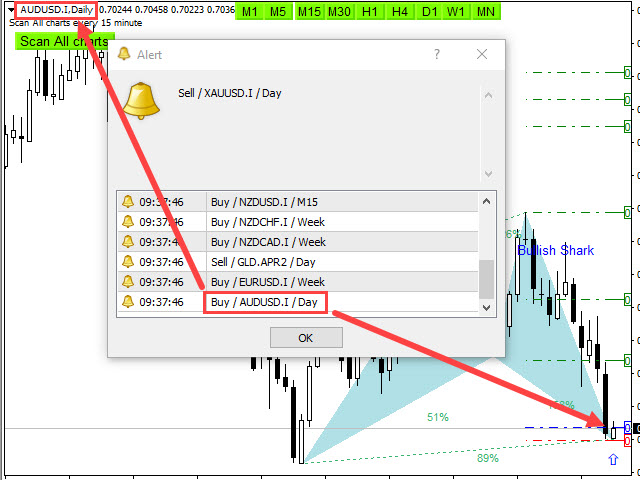
- Envío de alertas y notificaciones push
- Activación/desactivación de alertas en función de la hora configurada
- Ajuste la configuración del patrón
Parámetros de entrada
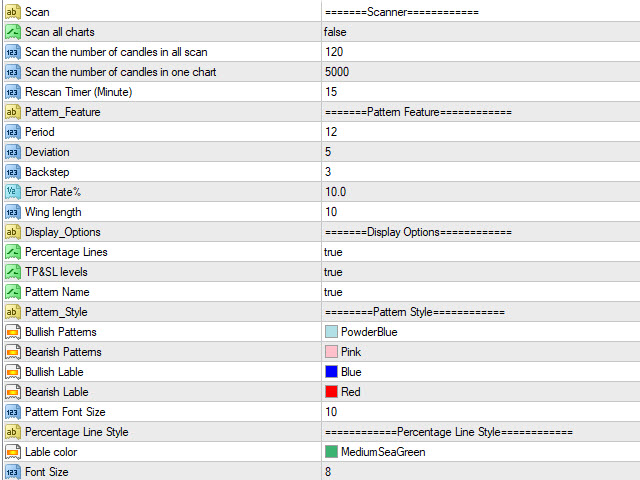
=========Scanner============
- Escanear todos los gráficos - Escanear en todos los gráficos y en todos los marcos de tiempo
- Escanear el número de velas - Cantidad de barras históricas a evaluar
- Re scan Timer - Volver a escanear todos los gráficos y todos los marcos de tiempo después de pasar el tiempo
- Método - elija cómo aparecer un patrón: breakout(after breakout) o patrón(in leg 4)
=======Pattern Feature============
- Pattern Feature(Period, Deviation, Back step) - Algoritmo Parámetros para el reconocimiento de patrones
- Porcentaje de error - Error máximo permitido en relación con el porcentaje del patrón
- Longitud del ala - Distancia mínima entre dos patas de un patrón
=======Display/style Options============
- Opciones de visualización - Muestra o no las líneas de porcentaje, los niveles de Take Profit y Stop Loss o el nombre del patrón.
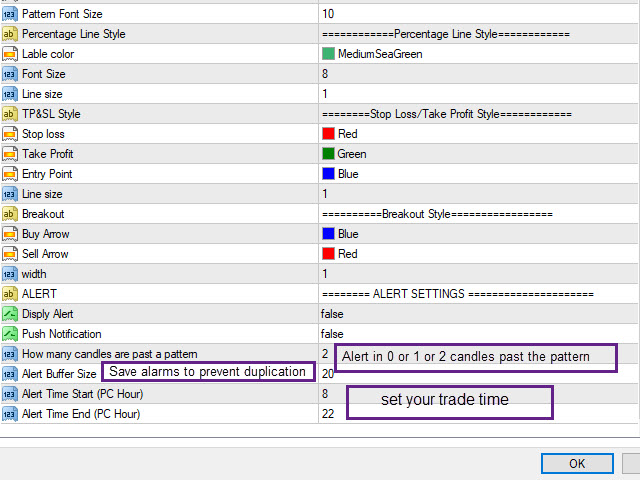
- Patrón, Línea de Porcentaje, Niveles de Stop Loss/Take Profit y Estilo de Breakout - Establece las Fuentes y colores de los patrones.
========CONFIGURACIÓN DEALERTAS ==========
- Mostrar Alerta o Notificación Push - Activar o desactivar Alerta o Notificación Push
- Cuántas velas han pasado de un patrón - Número máximo de velas pasadas de un patrón para permitir la alerta
- Tamaño del Buffer de Alerta - Máximo de alertas guardadas para evitar alertas duplicadas
- Hora deinicio/fin de la alerta - Determina las horas de negociación basándose en el reloj del ordenador para activar y desactivar la alarma


Harmonic scanner is significantly different from other scanners in the market. Currently, I am satisfied with the profit level. I hope to continue to achieve good performance, come on! Quickly answer on any question from the seller,really ,good sevice after selling.