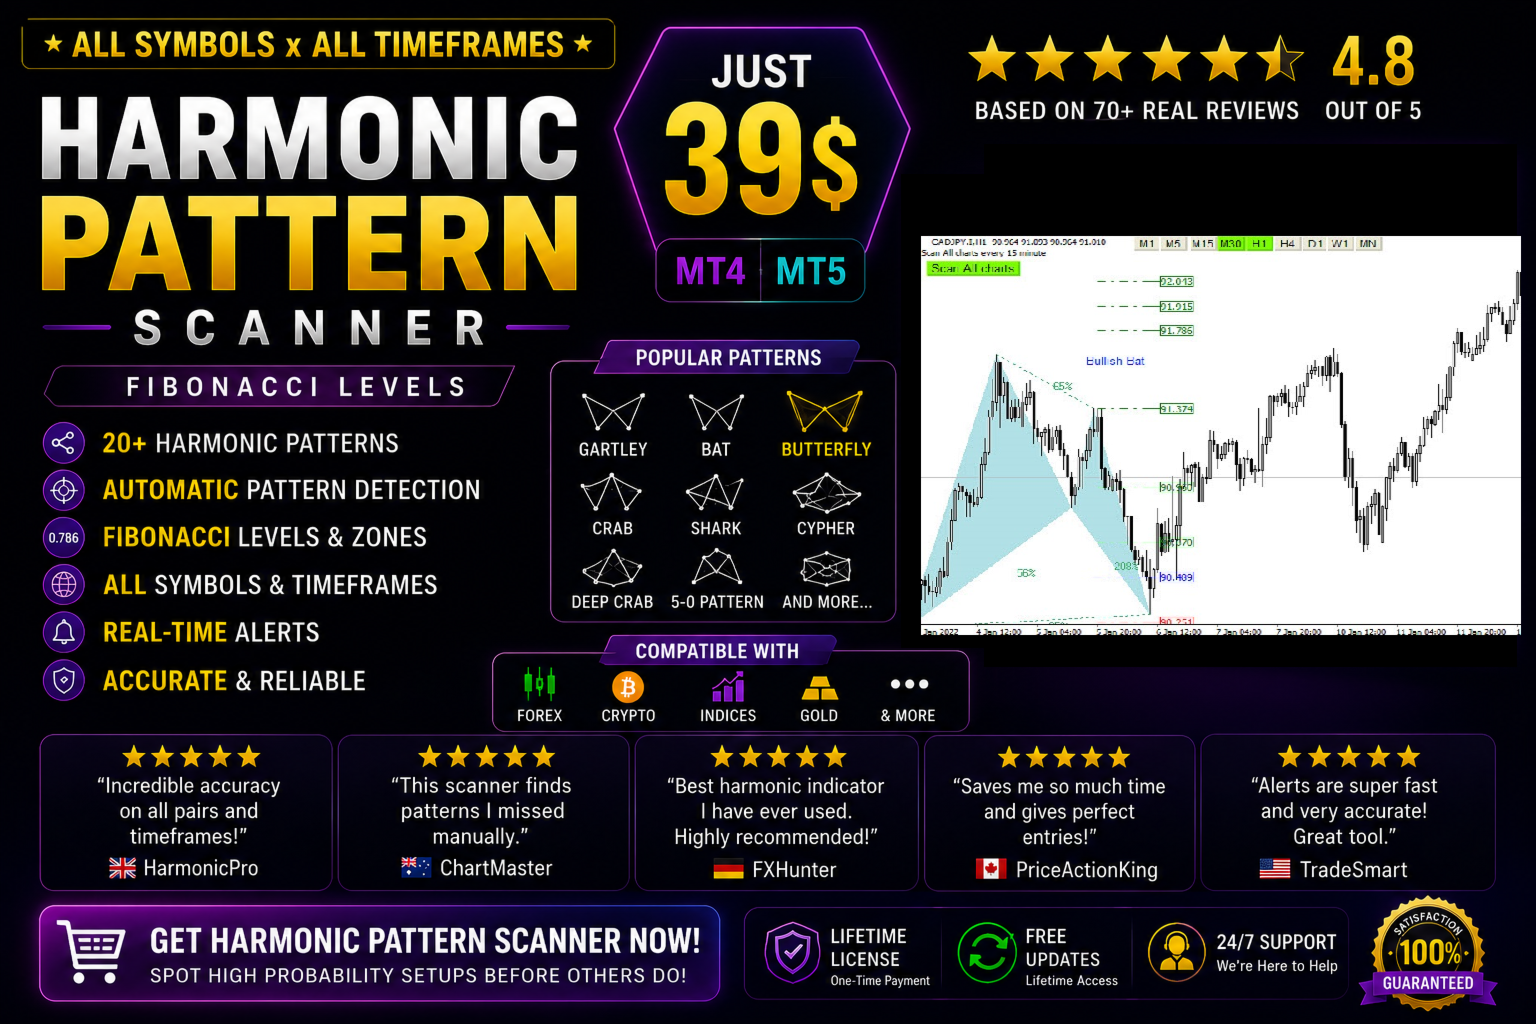
Harmonic Patterns Scanner MT5
- Indikatoren
-
Reza Aghajanpour
 =============================================================================================
<<<<<< Our team after 19 years of experience in the markets and programming would like to share winner solutions with you. >>>>>> - Version: 1.11
- Aktualisiert: 24 Januar 2026
- Aktivierungen: 20
Einführung
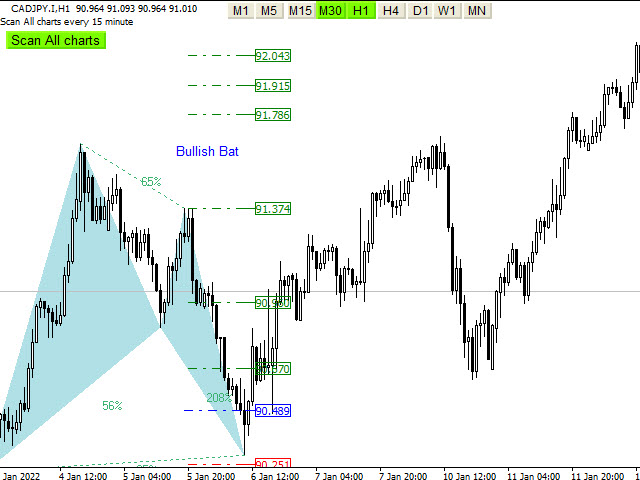
Harmonic Patterns sind am besten geeignet, um Wendepunkte vorherzusagen. Harmonic Patterns bieten Ihnen eine hohe Gewinnrate und eine hohe Handelsmöglichkeit an einem Tag. Dieser Indikator erkennt die besten und erfolgreichsten Muster, die auf harmonischen Handelskonzepten basieren.
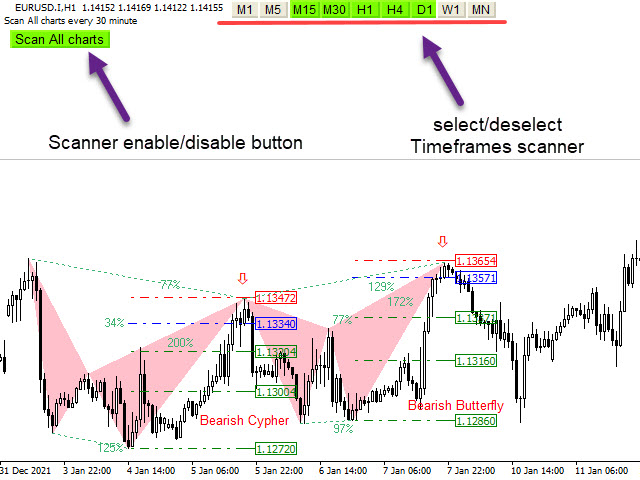
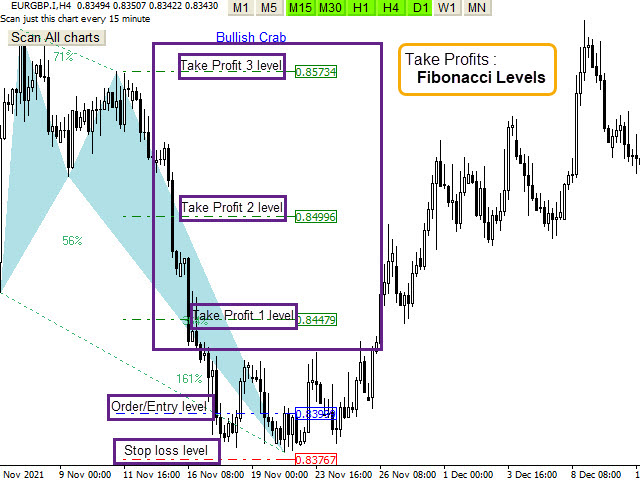
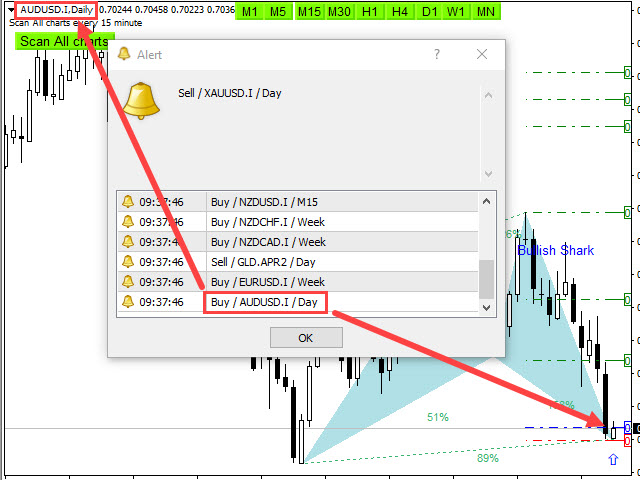
DerHarmonic Patterns Scanner scannt alle Charts mit nur einem Klick. Er verfügt über Stop-Loss-, Take-Profits- und Entry-Point-Levelsunter Verwendung von Fibonacci-Levels und Candlestick-Checks, um den besten Einstiegs- und Ausstiegspunkt für den Handel zu finden. Es findet Signale sofort mit Alarm und Benachrichtigung für den einfachen Handel.
Hauptmerkmale
- Erkennen Sie die besten und erfolgreichsten Muster: Gartley, Bat, Crab, Butterfly, Cypher, Shark, Alt Bat, Deep Crab.
- Einfach zu bedienender und benutzerfreundlicher Indikator
- Schaltfläche zum Scannen aller Charts (Forex, Cryptocurrencies, Indizes und Rohstoffe )
- Auswahl und Abwahl der Zeitrahmen für den Scan (M5,M15,M30,H1,H4,D1,W1,MN)
- Es zeigt und schiebt Benachrichtigung Stop-Loss, Entry-Point und Take-Profit-Levels
- Candlestick-Prüfung für den besten Einstiegspunkt
- Methode, um zu wählen, wie das Muster erscheint: Ausbruch (nach dem Ausbruch) oder Muster (in Bein 4)
- Verwendung der Fibonacci-Ebenen
- Es zeichnet die ABCD-Projektion
- Erkennung der potentiellen Umkehrzone (PRZ) zur Identifizierung der Umkehrung
- Erkennung der potentiellen Fortsetzungszone (PCZ) zur Vorhersage der Preisbewegung
- Erkennung des Pattern Completion Interval (PCI) für mehr Handelsmöglichkeiten
- Senden von Alarmen und Push-Benachrichtigungen
- Aktivieren/Deaktivieren von Alarmen je nach eingestellter Zeit
- Anpassung der Mustereinstellung
Eingabe-Parameter
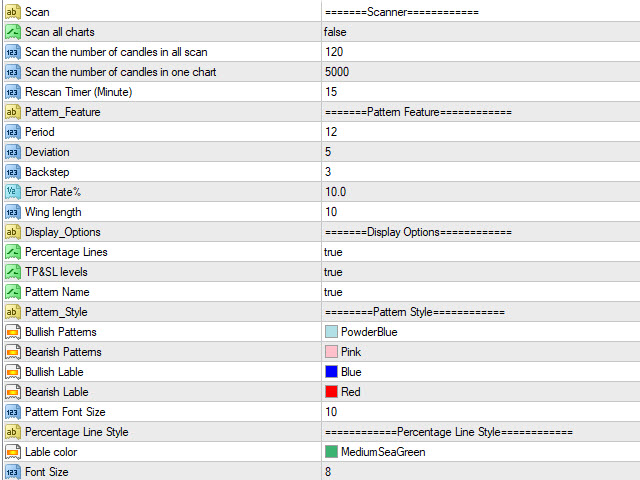
=========Scanner============
- Scan All Charts - Scan in allen Charts und allen Zeitrahmen
- Scan the number of candles - Anzahl der auszuwertenden Verlaufsbalken
- Re-Scan Timer - Erneutes Scannen aller Charts und aller Zeitrahmen nach Ablauf der Zeit
- Methode - Wählen Sie, wie ein Muster erscheint: Ausbruch (nach Ausbruch) oder Muster (in Leg 4)
=======Pattern Feature============
- Mustermerkmal (Periode, Abweichung, Rückschritt) - Algorithmus Parameter für die Mustererkennung
- Fehlerrate - Maximal zulässiger Fehler im Verhältnis zum Musteranteil
- Flügellänge - Mindestabstand zwischen zwei Schenkeln in einem Muster
=======Display/style Options============
- Anzeigeoptionen - Prozentuale Linien, Gewinnmitnahme- und Stop-Loss-Niveaus oder Mustername anzeigen oder nicht anzeigen
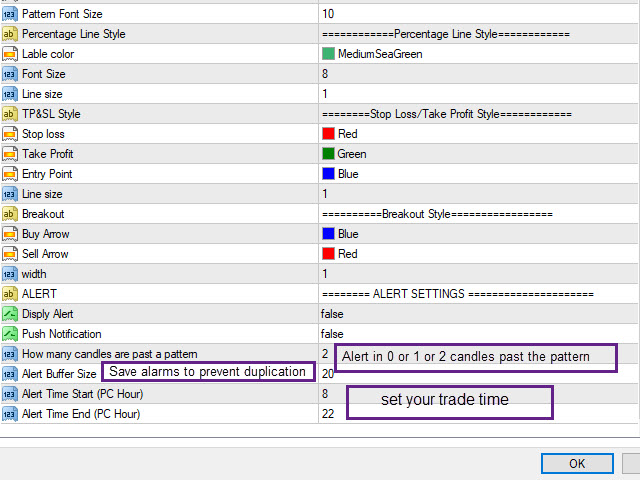
- Muster, prozentuale Linien, Stop Loss/Take Profit-Levels und Ausbruchsstil - Einstellung der Schriftarten und Farben der Muster
========ALARMEINSTELLUNGEN ==========
- Warnung oder Push-Benachrichtigung anzeigen - Aktivieren oder deaktivieren Sie die Warnung oder Push-Benachrichtigung
- Wie viele Kerzen liegen hinter einem Muster - Maximale Anzahl von Kerzen, die von einem Muster vergangen sind, um einen Alarm zuzulassen
- Größe des Alarmspeichers - Maximale Anzahl der gespeicherten Alarme, um doppelte Alarme zu vermeiden
- Alert start/end time - Bestimmen Sie die Handelszeiten basierend auf der Computeruhr, um den Alarm zu aktivieren und zu deaktivieren.


Harmonic scanner is significantly different from other scanners in the market. Currently, I am satisfied with the profit level. I hope to continue to achieve good performance, come on! Quickly answer on any question from the seller,really ,good sevice after selling.