The 1 2 3 Pattern Scanner MT5
- Indicadores
-
Reza Aghajanpour
 =============================================================================================
<<<<<< Our team after 19 years of experience in the markets and programming would like to share winner solutions with you. >>>>>> - Versión: 1.26
- Actualizado: 7 enero 2026
- Activaciones: 20
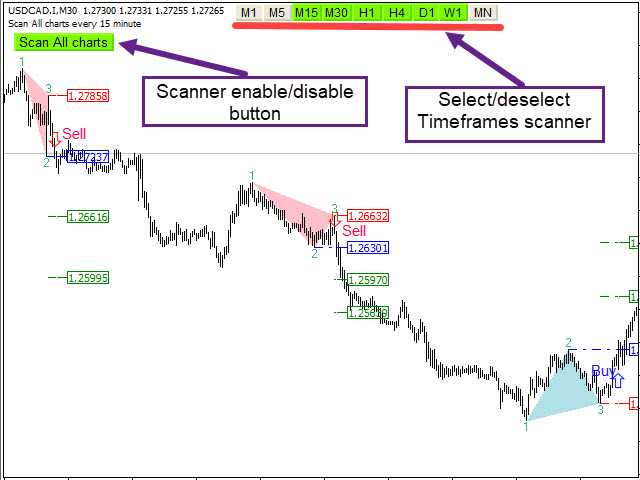
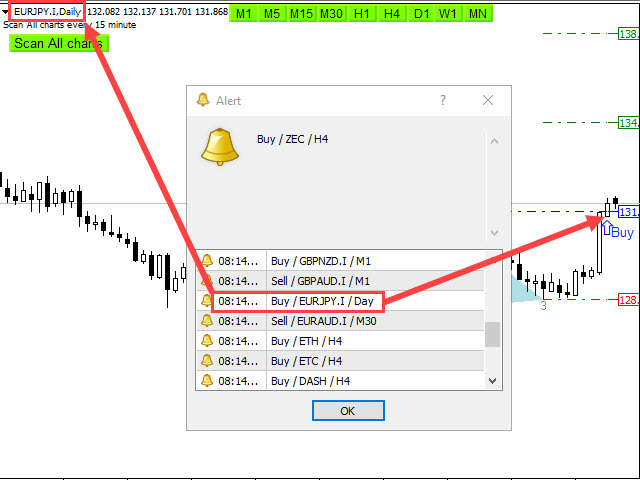
** Todos los Símbolos x Todos los Plazos escanean con sólo pulsar el botón del escáner **
Después de 18 años de experiencia en los mercados y la programación, Winner indicador está listo. ¡Me gustaría compartir con ustedes!
Introducción
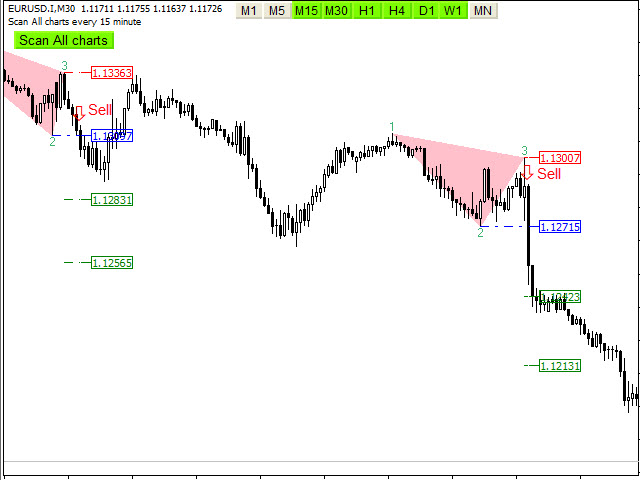
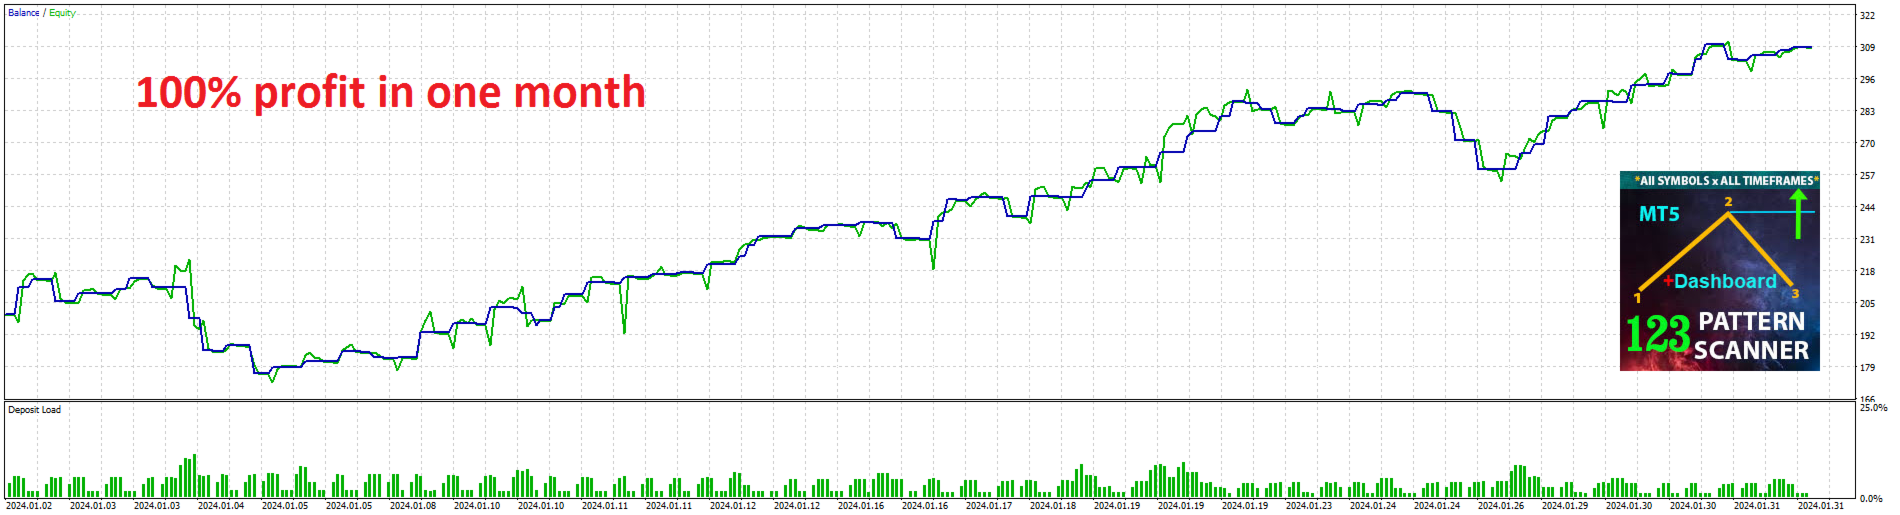
El indicador 123 Pattern Scanner con un algoritmo especial mejorado es un buscador de patrones comunes muy repetitivo con una alta tasa de éxito. Curiosamente, este indicador Winner indica que la tendencia ha cambiado su dirección o el final de un retroceso de tendencia o incluso el 1 2 3 Patrón aparece en el mercado de rango.
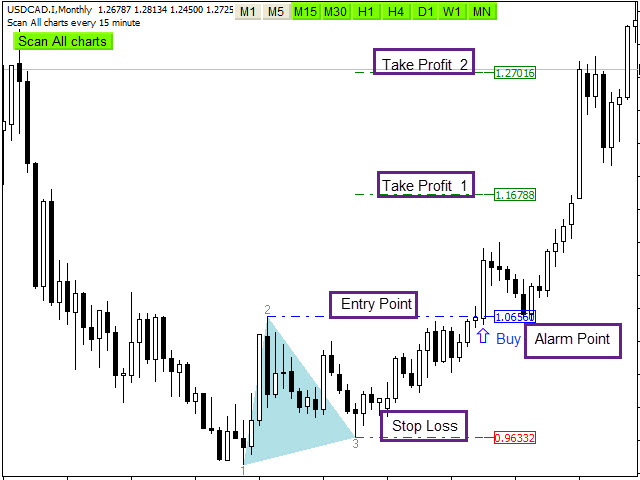
El 1,2,3 Pattern Scanner encuentra inmediatamente con alarma y notificación y también tiene stop loss, take profits y punto de entrada con comprobación de velas para facilitar el trading.
+Usted puede encontrar 123 Patrón Expert Advisor(EA) "AI Next Level" aquí.
Características principales
- Utiliza un algoritmo especial mejorado
- Detecta el mejor y más exitoso patrón con muy repetitivo en tendencia, swing y breakout.
- Indicador fácil de usar y amigable
- NO repinta
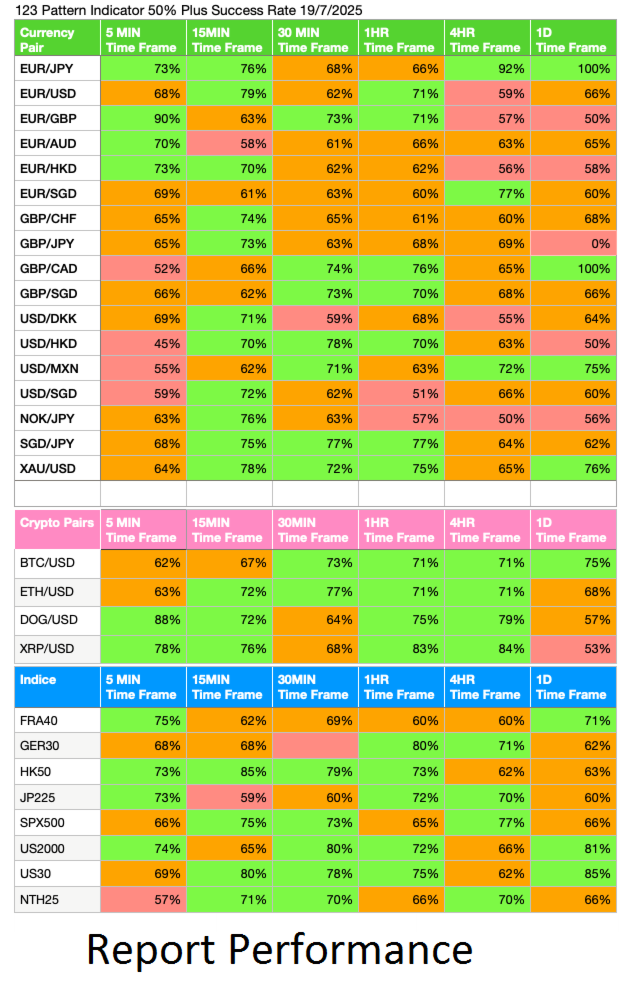
- Escanea todos los gráficos ( Forex, Crypto, Índices y materias primas)
- Selecciona y deselecciona marcos de tiempo para escanear (M1,M5,M15,M30,H1,H4,D1,W1,MN)
- Muestra y notifica los niveles de stop-loss, entry-point y take-profit.
- Comprobación de velas para el mejor punto de entrada
- Método para elegir cuando aparece el patrón: ruptura (después de la ruptura del punto 2) o patrón (en el punto 3)
- Envío de la alerta, push y notificación por correo electrónico
- Activación/desactivación de la alerta en función de la hora configurada
- Ajuste la configuración del patrón
- Riesgo a recompensa: 1:2
Parámetros de entrada
=========Scanner============
- Escanear todos los gráficos - Activado
- Escanear el número de velas - Cantidad de barras históricas a evaluar
- Rescan Timer - Reescanea todos los gráficos y todos los marcos de tiempo después de pasar el tiempo
- Método - elija cuando aparece un patrón: breakout(después del breakout en el punto 2) o patrón(en el punto 3)
=======Pattern Feature============
- Pattern_Feature(Period, Deviation, Backstep) - Parámetros del algoritmo para el reconocimiento de patrones
- Error_Rate - Error máximo permitido en relación con el porcentaje del patrón
- Wing length - Distancia mínima entre dos patas de un patrón
=======Display/style Options============
- Display_Options - Mostrar o no los niveles TP&SL
- Niveles Stop Loss/Take Profit y Breakout Style - Configurar las fuentes y colores de los patrones
- Chart view - Esquema de colores del gráfico (Blanco / Negro / No cambiar)
========CONFIGURACIÓN DE ALERTAS ==========
- Mostrar Alerta o Notificación Push - Activar o desactivar Alerta o Notificación Push
- Cuántas velas han pasado de un patrón - Número máximo de velas pasadas de un patrón para permitir la alerta
- Tamaño del Buffer de Alerta - Máximo de alertas guardadas para evitar alertas duplicadas
- Hora de inicio/fin de la alerta - Determina las horas de negociación basadas en el reloj del ordenador para activar y desactivar la alarma


This is a very reliable and effective indicator for spotting profitable trades. It also easy to use.