ABCD Pattern Scanner MT5
- Indicadores
-
Reza Aghajanpour
 =============================================================================================
<<<<<< Our team after 19 years of experience in the markets and programming would like to share winner solutions with you. >>>>>> - Versión: 1.10
- Actualizado: 20 febrero 2026
- Activaciones: 20
** Todos los Símbolos x Todos los Plazos escanean con sólo presionar el botón del escáner.
*** Ponte en contacto conmigo para enviarte las instrucciones y añadirte al "grupo de escáneres ABCD" para compartir o ver experiencias con otros usuarios.
Introducción
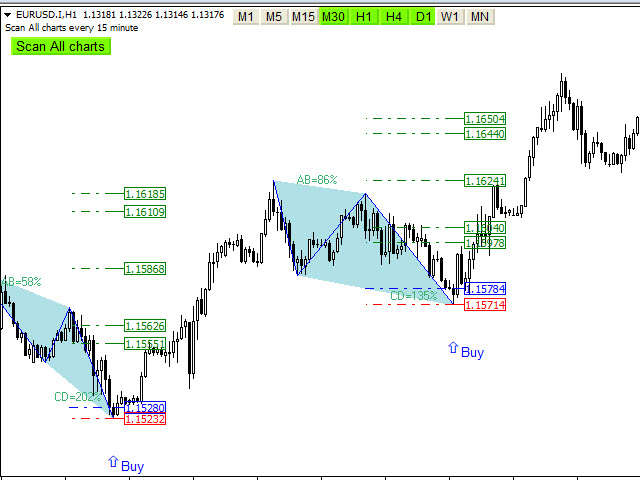
Este indicador escanea patrones de retroceso AB=CD en todos los gráficos. El ABCD es el fundamento básico de todos los patrones armónicos y altamente repetitivo con una alta tasa de éxito.
El indicador ABCD Scanner es un patrón ABCD de reversión de escáner que le ayuda a identificar cuando el precio está a punto de cambiar de dirección. La idea es que usted puede comprar cuando los precios son bajos y vender cuando son altos. Este indicador es fácil de usar con stop loss, punto de entrada y nivel de toma de beneficios. El punto de entrada se basa en la comprobación del patrón de velas.
Características principales
- Detecta los mejores y más exitosos patrones: AB=CD, Perfect ABCD
- Indicador fácil de usar
- Botón de escaneo de todos los gráficos ( Forex, Crypto, Índices y materias primas)
- Selecciona y deselecciona marcos de tiempo para escanear (M5,M15,M30,H1,H4,D1,W1,MN)
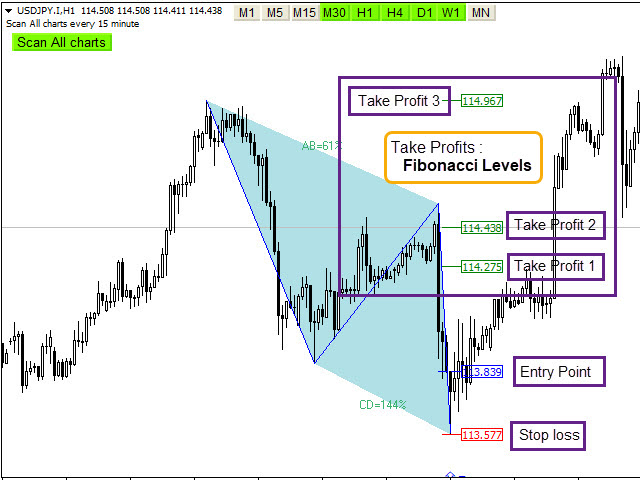
- Muestra y notifica los niveles de stop-loss, entry-point y take-profit.
- Comprobación de velas para el mejor punto de entrada
- Método para elegir el patrón de aparición: ruptura (después de la ruptura) o patrón (en la pierna 4)
- Uso de los niveles de Fibonacci
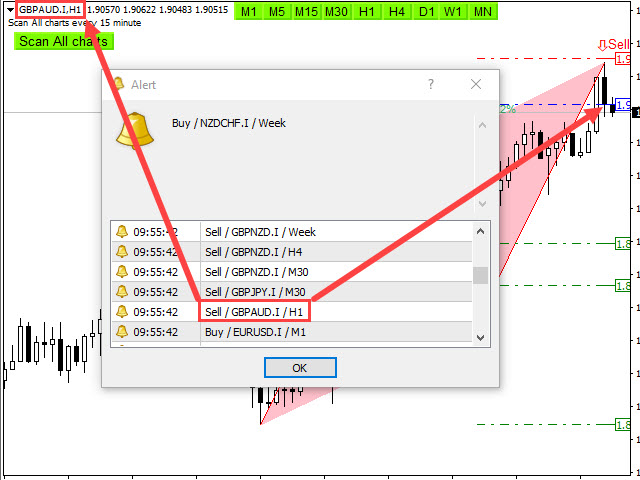
- Envío de alertas, notificaciones push y por correo electrónico
- Activación/desactivación de la alerta en función de la hora configurada
- Ajuste la configuración del patrón
- Scan All Charts - Escanea todos los gráficos y todos los marcos de tiempo
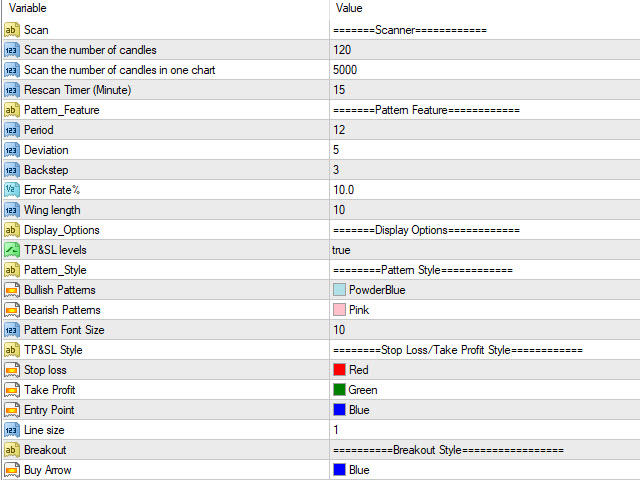
- Scan the number of candles - Cantidad de barras históricas a evaluar
- Re-scan Timer - Re-scanea todos los gráficos y todos los marcos de tiempo después de pasar el tiempo
- Method - elige cómo aparecer un patrón : breakout(after breakout) o pattern(in leg 4 )
- Característica del patrón (Período, Desviación, Paso atrás) - Parámetros del algoritmo para el reconocimiento de patrones
- Porcentaje de error - Error máximo permitido en relación con el porcentaje del patrón
- Longitud del ala - Distancia mínima entre dos patas de un patrón
- Opciones de visualización - Mostrar o no líneas de porcentaje, niveles TP&SL
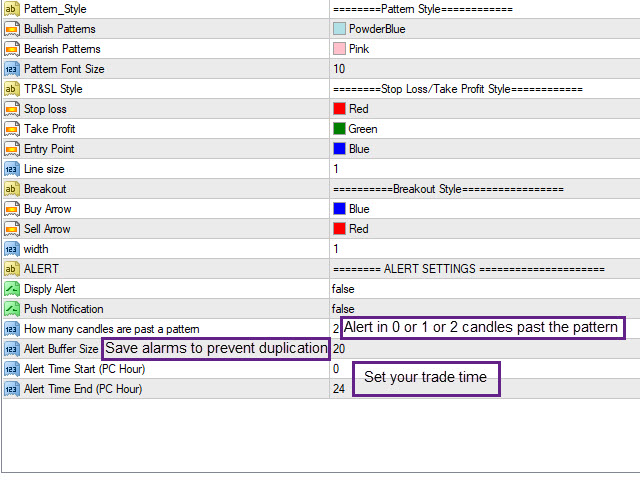
- Patrón, Línea de Porcentaje, niveles de Stop Loss/Take Profit y Estilo de Breakout - Configurar las Fuentes y colores de los patrones
- Mostrar Alerta o Notificación Push - Activar o desactivar Alerta o Notificación Push
- Cuántas velas han pasado de un patrón - Número máximo de velas pasadas de un patrón para permitir la alerta
- Tamaño del Buffer de Alerta - Máximo de alertas guardadas para evitar alertas duplicadas
- Hora de inicio/fin de la alerta - Determina las horas de negociación basadas en el reloj del ordenador para activar y desactivar la alarma
Parámetros de entrada
=========Scanner============
=======Pattern Feature============
=======Display/style Options============
========CONFIGURACIÓN DE ALERTAS ==========
Punto C Retracción BC Proyección
0.382 2.618
0.50 2.0
0.618 1.618
0.707 1.41
0.786 1.27
0.886 1.13


Support is good. After some support & adjustment to my computer, the EA start act promptly. With this indicator giving an alert, entry point, exit point, TP & SL, I had somehow make a profit to cover the cost of this EA. Worth the purchase.